There are a lot of reasons to question the Bureau of Labor Statistics Employment Situation Summary Report, and even more reasons to question corporate media’s coverage of it.
Yet even if the ESSR is accurate, what it is saying about the state of US labor markets and the United States labor force is not at all optimistic. What the report is telling us is disturbing, and perhaps even scary.
According to the Employment Situation Summary Report, we have in this country a growing epidemic of idleness. For all the bloviating reporting about how “strong” the labor markets are within the US economy, what the report shows is the growing extent to which Americans are NOT working.
The corporate media narrative leaves nothing to doubt in its messaging: labor markets are doing well and the Federal Reserve’s policies are helping to keep them doing well.
•Economists had projected 140,000 jobs were added in September and that the unemployment rate held steady at 4.2%.
•The jobs report has moved back into the spotlight now that the Federal Reserve has all but declared victory on inflation and is focused on keeping the labor market healthy.
By the same token, I leave nothing to doubt with my messaging. Labor markets are not doing well.
Once again, we are left with a jobs report that, in the best case scenario, is yet another illustration of the levels of imbalance and disquilibrium in the nation’s economy. In the worst case, the jobs report is a wild exaggeration that will result in yet more significant corrections over the next few months.
The headline numbers certainly sound positive and optimistic. The headline numbers certainly feed the narrative of economic health and resiliency being promoted by the corporate media.
When we look beyond the headline numbers, however, we find once again numerous signs of a labor market that is still toxic and an economy that is still experiencing an ongoing jobs recession that has yet to abate.
However, we also do well to remember that the purpose of all data collection is analysis, and if we’re using the data wisely, we’re making informed decisions based on that analysis. While we can and should question the data’s integrity and accuracy, we must acknowledge that this is the data we have, that this is the data the government uses, and so it behooves us to tease out whatever trends and tendencies that data can convey.
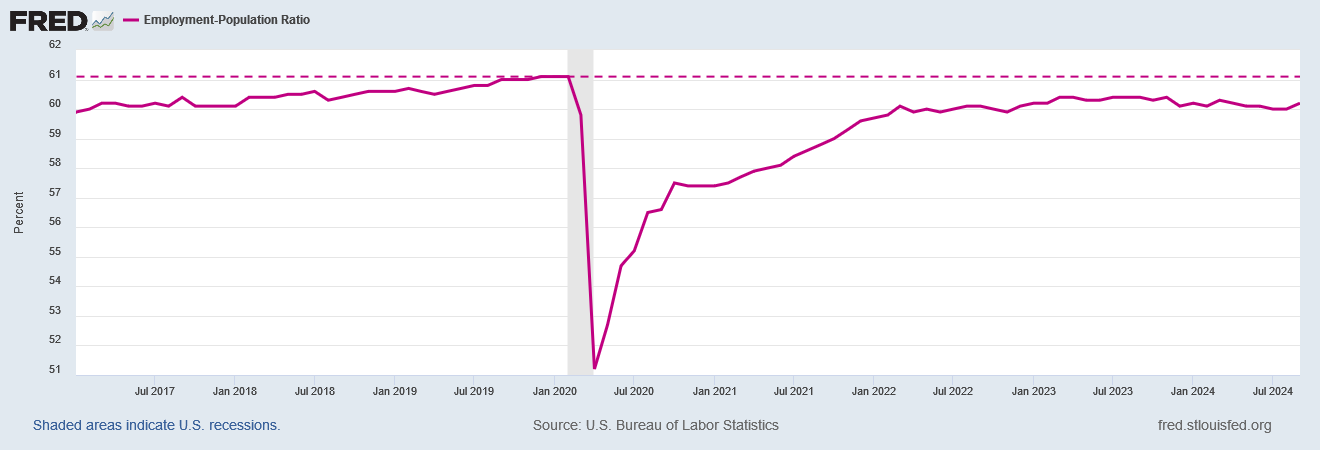
One of the most significant trends the data conveys is that of decreasing work.
How do we know this? When we look at the ratio of employed individuals to the overall population, that is exactly what we see.
However many jobs we are creating, it is not nearly enough to keep people employed.
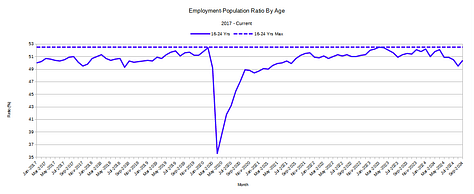
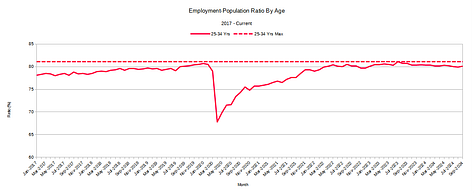
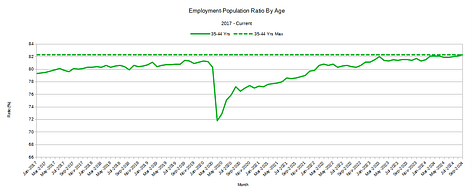
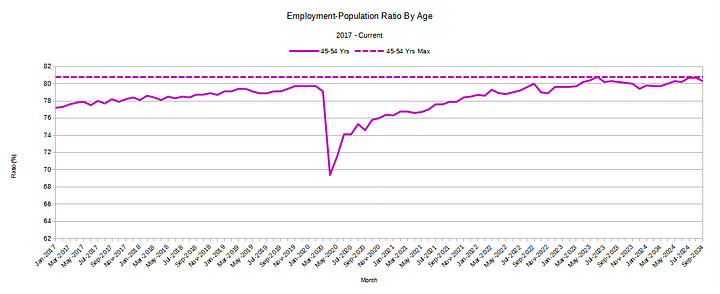
The declining ratio is visible across all age cohorts as well. When we query the BLS data directly, and parse out the employment ratios by age, we see the same tendency to varying degrees across all age brackets.
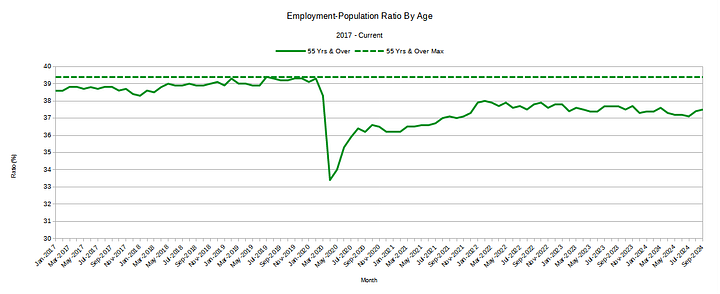
From an economic perspective, the ideal is that people should be productive. That requires people have jobs.
Even if we accept as valid the 254,000 figure reported by the BLS, even that number of jobs is proving inadequate to the growing population within the US.
We should be especially concerned about the declining employment population ratio for the younger age brackets. A declining ratio among young people means an increasing number of people in the 16-24 age range who are not gainfully employed. That’s an increasing number of people in the 16-24 age range who are not learning the skills they need in order to work—they are not mastering a technical skill of some sort and they are not mastering the “soft” skills necessary to navigate the workplace. Unemployed youth are a far greater economic concern than the unemployed in all other age groups simply because the economic costs of that unemployment are much longer lasting.
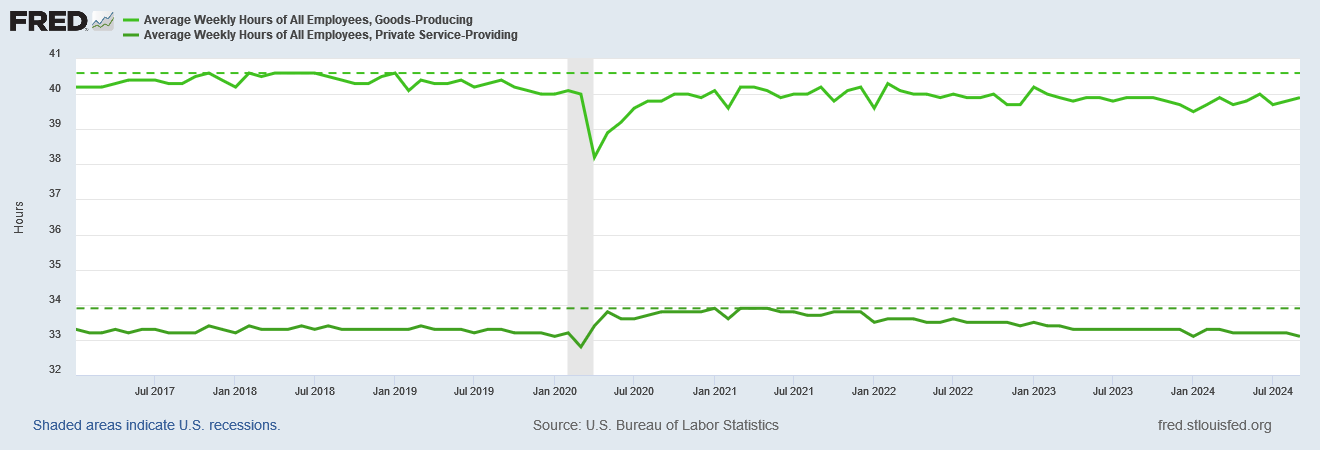
Even when people are working, however, they are working less, not more—and that bodes ill for workers’ earning potentials.
At an average work week of 34.2 hours, people are working less now than before the Pandemic Panic.
Workers now are working fewer hours than at any time since July, 2010 (excluding the work disruptions of the Pandemic Panic itself).
These declining averages are found across multiple economic sectors.
Even when people have jobs, there is less “job” than before.
Fewer hours worked means fewer hours on the paycheck, and that results in a smaller paycheck. This makes the inflation and the distortions post-COVID a double whammy for most workers.
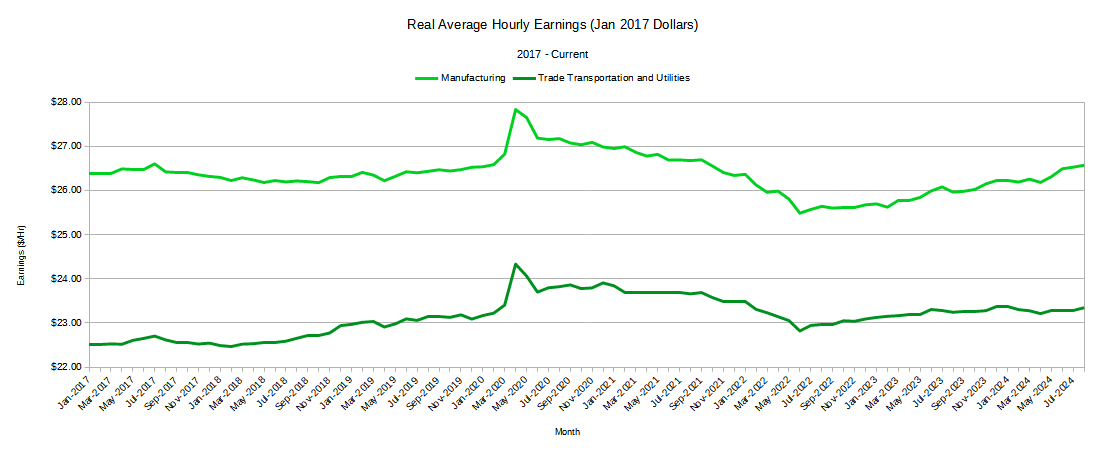
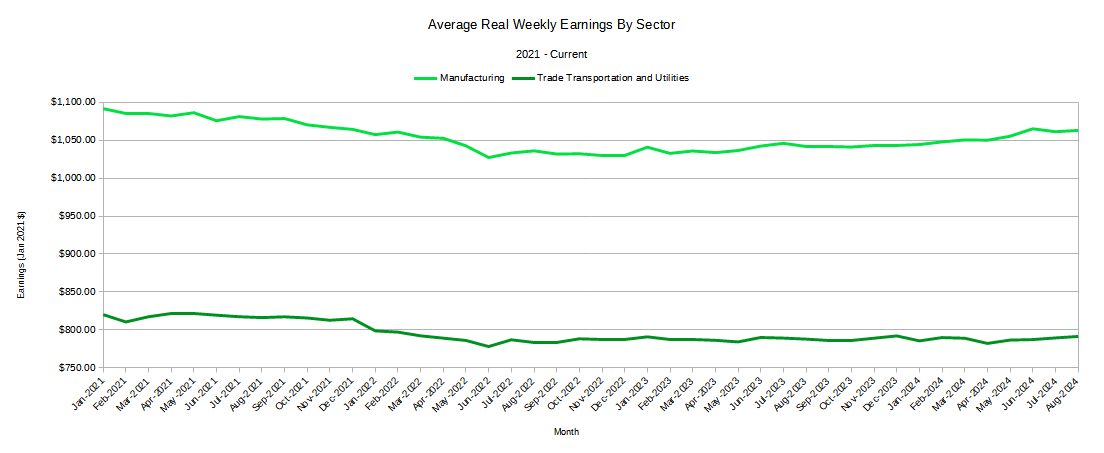
First, inflation shrinks the hourly wage significantly, across all sectors.
Applying that reduced hourly wage to reduced hours means and even more reduced weekly paycheck.
As with the hours worked, no sector is spared from this.
Inflation is an equal-opportunity predator against human prosperity.
At this point, I am truly beating the dead horse to point out how these data points do not chart a labor force or a labor market that is “resilient”, or “robust.” These data points, as I have said many times before, chart a labor force and a labor market that is quite toxic.
These data points chart an economy that is experiencing not strong labor growth but labor contraction. These data points chart an economy that is experiencing a jobs recession.
For all of the (Biden-)Harris pontification, posturing, and preening to the contrary, these data points chart an econonmy in which manufacturing especially has been suffering, and is continuing to suffer.
No matter how one apprehends economics or politics, no matter whether one prefers Kamala Harris or Donald Trump, certain basic priorities surely apply when contemplating the direction in which this country is headed.
Surely people want a country where there are jobs to be had, and good wages to be earned. This data says there are not enough jobs to be had and not enough good wages to be earned.
Surely people want a country where young people have the opportunity to learn a trade, master a craft, aspire to a profession, and make their way in the world. This data says there are not enough opportunities for young people to learn a trade, master a craft, or aspire to a profession, leaving it in grave doubt how they will make their way in the world.
Surely people want a country where our children can look forward to a prosperous future. This data says we are not on course to have a prosperous future, either for our selves or our children.
If ever there was an argument to be made for radical change across the whole of this country, this data surely makes that argument.
We are not heading in a good direction. We need to change direction, and soon.






The economic picture is even worse than these figures show, because they don’t point out the increase in disability in our population. We know from other medical data that the US population has become increasingly obese, diabetic, drug-addicted, and afflicted with other infirmities (including vaccine-injured) that leave them long-term disabled and dependent upon the government. So you’re right, Peter, the big picture is not bright.
The corporate titans who are presumably in the know seem to agree with your assessment of the economy.
https://www.wsj.com/finance/stocks/stock-market-rally-corporate-insiders-2bb59974?st=KbqkRN&reflink=article_copyURL_share