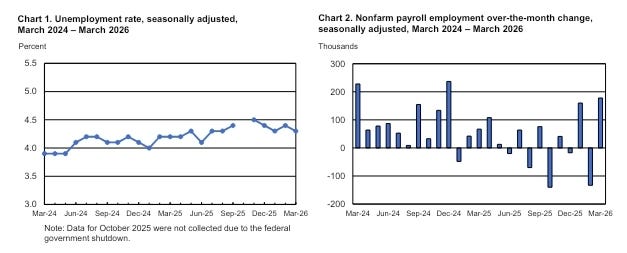
Total nonfarm payroll employment increased by 178,000 in March, and the unemployment rate changed little at 4.3 percent, the U.S. Bureau of Labor Statistics reported today. Job gains occurred in health care, in construction, and in transportation and warehousing. Federal government employment continued to decline.
Wall Street had expected numbers in line with the ADP report. Trading Economics was somewhat more pessimistic.
Instead, the BLS nearly tripled the ADP numbers.
As long-time readers are well aware, I am generally suspicious of numbers which sound too good to be true. Certainly the BLS has given us plenty of reasons to question the integrity of its methods.
Are the numbers too good to be true? Almost certainly. Not only must we consider the inevitable “revisions” that will happen next month and the following month, but we must also contend with diverging data within the March jobs report itself.
At the same time, there are reasons to conclude that there was robust job growth in March, at least as strong as reported by ADP. Even more encouraging, there are signs both the economy and the US labor market may be moving onto an accelerated growth trajectory. There is a distinct probability that President Trump’s economic policies are starting to bear serious fruit.
The March Employment Situation Summary may prove too good to be true, yet it may still prove to be still good.
To add to the confusion, the ongoing war with Iran upends all prognostication and projection. Everything now hinges on the duration of Operation Epic Fury and how long Persian Gulf oil flows will be disrupted. Regardless of whether we consider the March jobs report good or not good enough, it may not matter in the face of the gathering storm of oil price and supply shocks about to break over the global economy.
Every article I publish takes time, care, and independence. A paid subscription fuels that work and shields it from outside pressure. If you’re able, join me today.
Lou Costello Labor Math?
If the March jobs report is too good to be true, how can we establish that within the data itself? What clues are there that the job growth numbers are skewed higher than they should be.
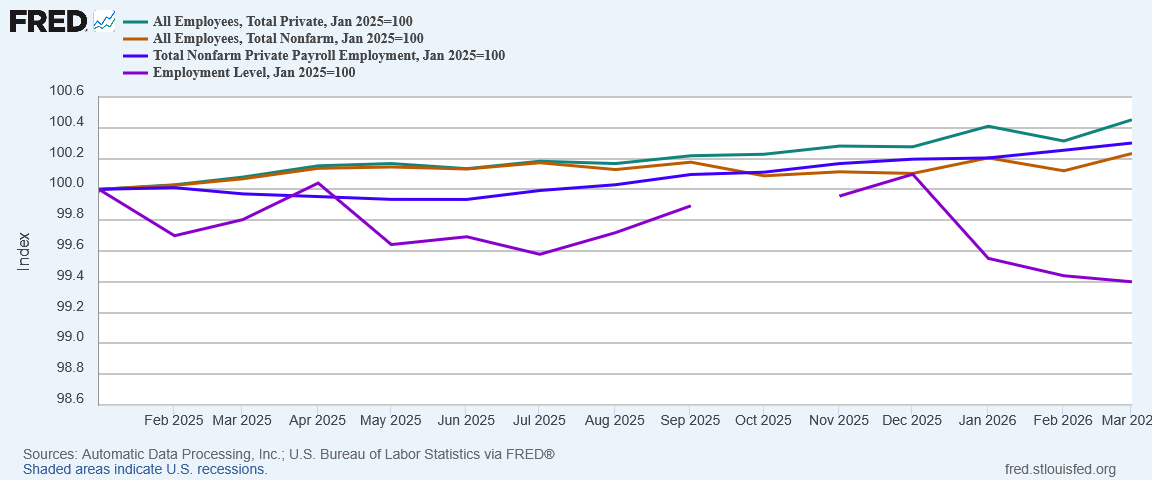
There is an easy test to establish if there is a credibility problem with the BLS jobs numbers: compare the results of the Establishment Survey and the Household Survey from within the Employment Situation Summary report alongside the ADP National Employment Report. As all three survey sets nominally are sampling from the same jobs market, we should expect to see broadly similar trends across all three.
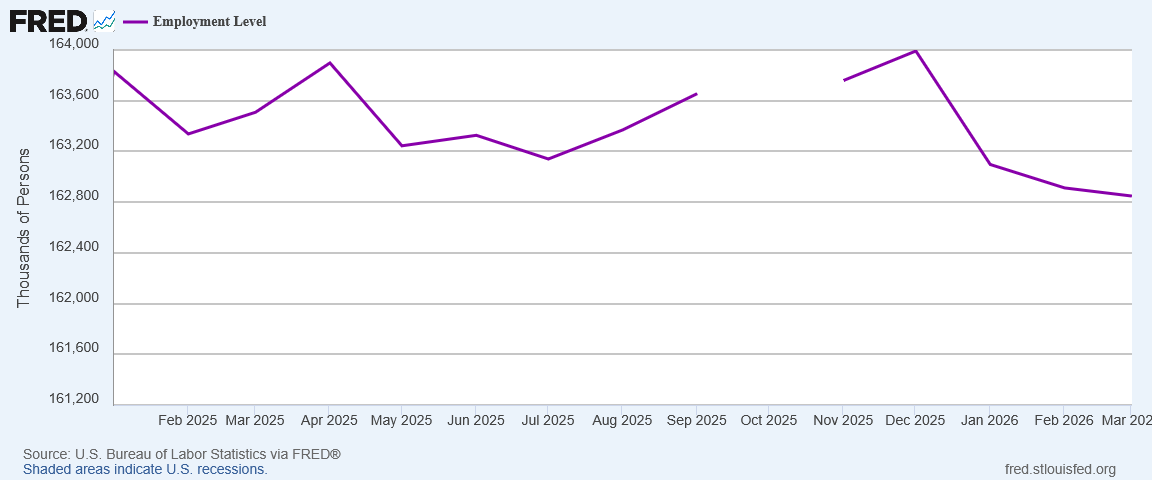
While the Employment Level trend vs the All Employees trend was problematic at best for 2025, over the past three months the Employment Level has broken completely with the Establishment Survey, posting declines as the jobs numbers are going up.
We should not expect the labor surveys to match precisely, but a 0.7pp decrease in the Household Survey’s Employment Level and a 0.2pp increase in the All Employees, Total Private data across the same time frame should not happen. Yet it has over the past three months.
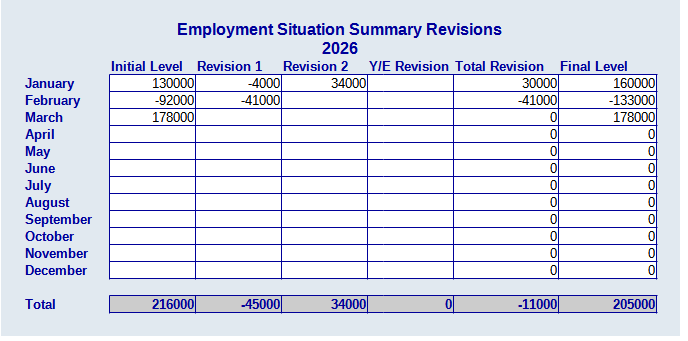
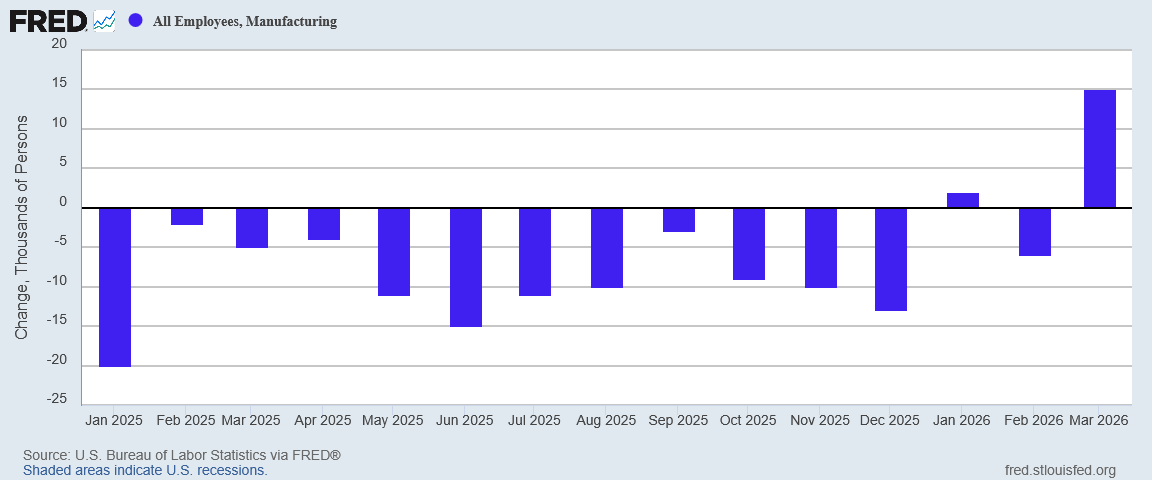
To this we must include consideration of the revisions that have already happened for 2026. Between revised numbers for January and February, the BLS’ job creation statistics already are guilty of overstating job growth by some 11,000 jobs just in the first two months.
Note especially the 41,000 reduction from February’s already horrendous job numbers, moderated in large part by a final and very optimistic revision to January. The total variance thus far is “only” 11,000 in the negative.
Regular downward revisions after the fact have been a recurring theme for the BLS jobs report in recent years, and 2026 is so far proving no exception.
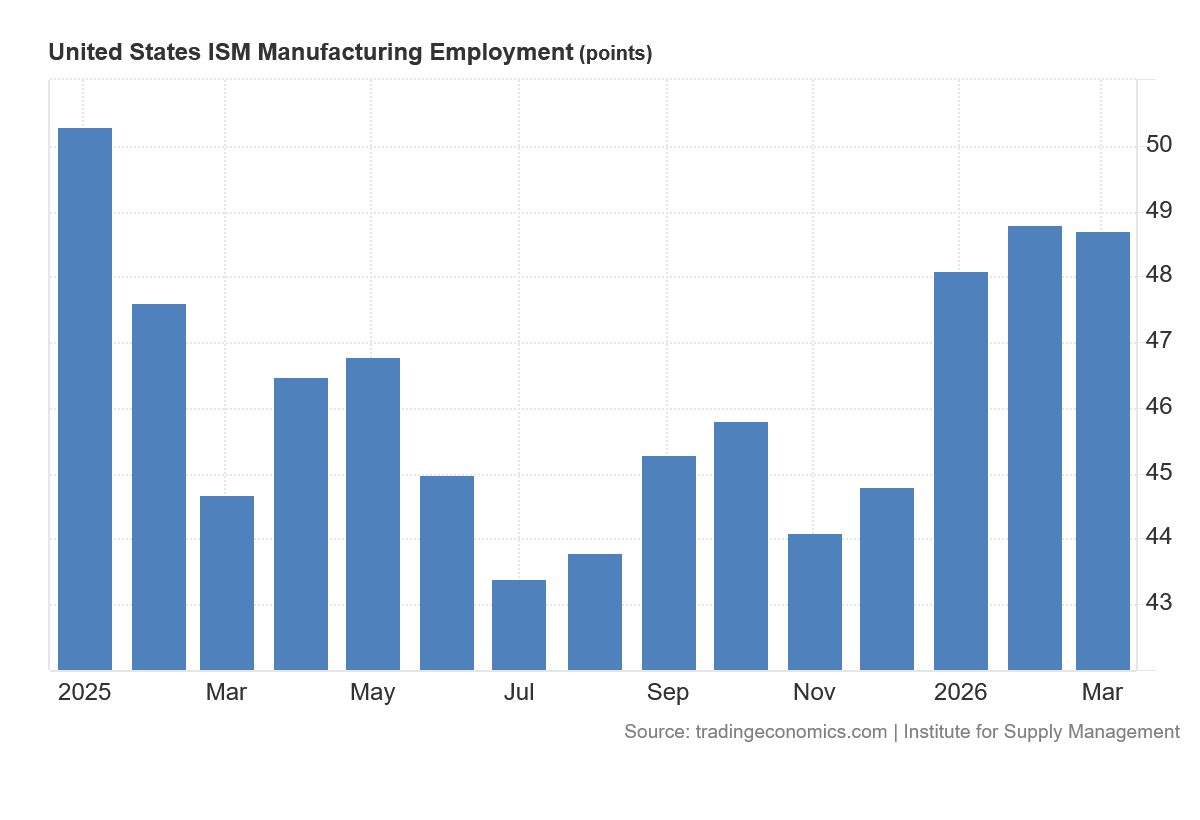
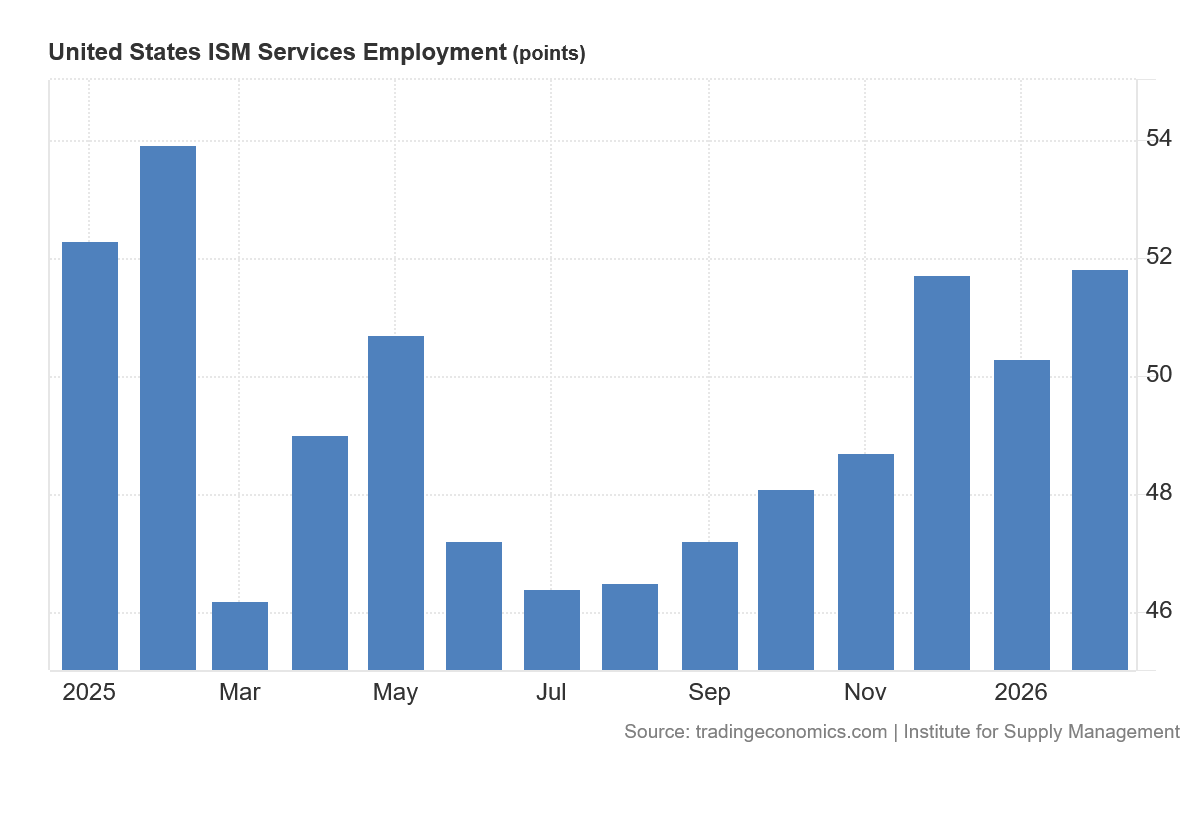
To the question marks raised just within the Employment Situation Summary itself, we must also consider recent PMI data from the Institute for Supply Management, which indicates that March was yet another contraction month for Manufacturing Employment—an outcome the BLS report flatly contradicts.
When looking at PMI data, any number above 50 indicates expansion (or job growth, in this case), and any number below 50 indicates contraction (or job loss).
We do well to take the March jobs report with a very large grain of salt. Not only is there a significant probability of continued downward revisions eliminating a significant portion of the reported 178,000 created jobs, there are contrarian signals both within the jobs report itself and in some of the external data.
The March report sounds too good to be true—and there are good reasons to believe that it is too good to be true.
The March jobs report blew out expectations with strong construction job growth and a surge in manufacturing job creation as trillions of dollars in investments begin to materialize. America remains on a solid economic trajectory thanks to President Trump’s proven agenda of tax cuts, deregulation, tariffs, and energy dominance.
If the job numbers hold up over time—and that is still a very big “if”—then the March report will stand as a strong indicator that the jobs recession may be at last coming to an end.
If the job numbers hold up over time, the Trump Administration’s victory lap will be well deserved.
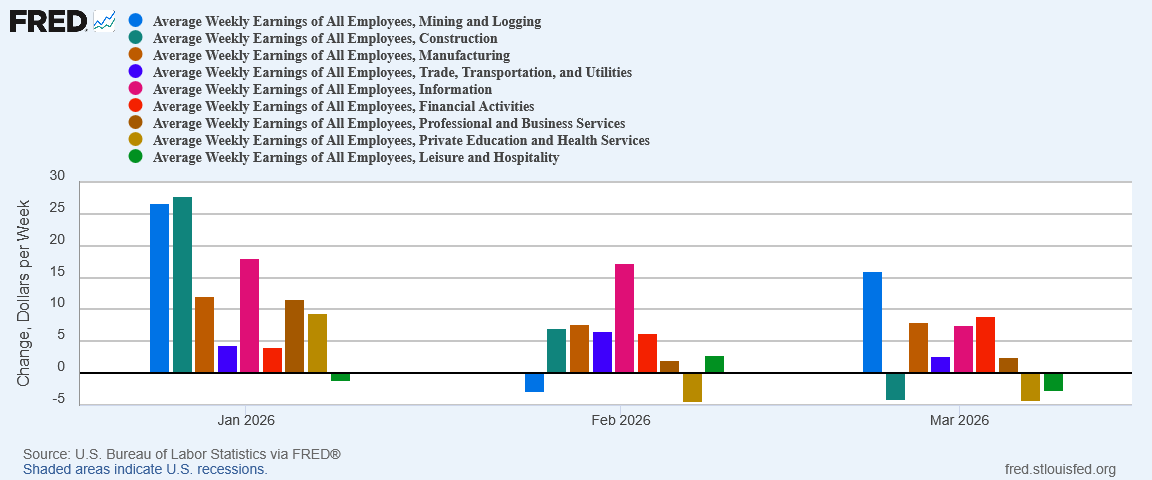
One encouraging sign in the jobs data is that most job sectors showed some growth in March.
Manufacturing posted strong job growth for the first time in over a year.
Construction also turned in strong job growth numbers, and Mining (which includes oil and natural gas production) posted a welcome reversal from the declines which marked 2025.
Construction and Mining Job Growth MoM
Among service sectors, Healthcare once again was the jobs creation leader, returning to strong job growth after a negative February (a contraction attributed largely to recent healthcare worker strikes). Leisure was another sector with strong job growth, with Trade, Transportation, and Utilities rebounding from February to post modest job gains. Professional Services, although continuing to fade from a January surge, also eked out marginally positive numbers.
Healthcare, Leisure, TTU, and Professional Services, MoM
Only two sectors printed job losses for March: Finance, which showed either weak growth or job loss through the latter half of 2025, and Information, which is continuing to shed jobs as it did throughout 2025.
Information and Finance, MoM
The March jobs report showed the sort of balanced job growth that has been lacking in recent jobs reports. While Healthcare’s continued dominance in job creation is cause for concern over the longer term, with most sectors reporting at least some job growth, there is no denying that the US economy needs to see many more job reports at the sector level like March. Nothing lifts all ships like a rising tide which manages to reach all ships.
While the jobs numbers from the Establishment Survey are undeniably good, the jobs report contains several areas which remain cause for concern.
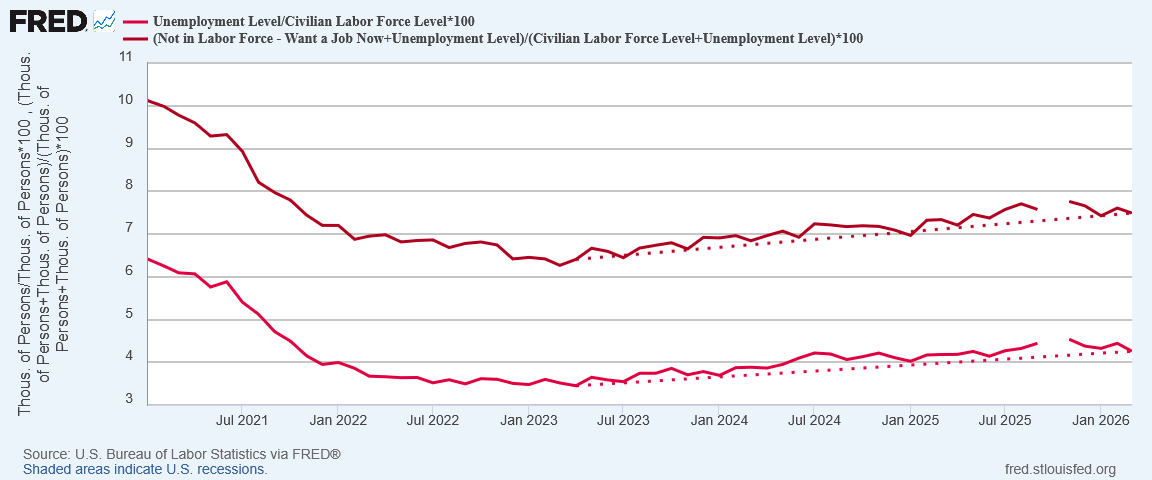
The unemployment rate did tick down, both at the official level and at the higher “real” level (which includes those not in the labor force but who want a job now).
While there is indication that both rates are trending down since last fall, they are still significantly above their January 2025 levels, and the longer term trend extending back to April 2023 is still one of increasing joblessness. Incremental improvement is improvement, but not enough to declare the trend of rising joblessness at an end.
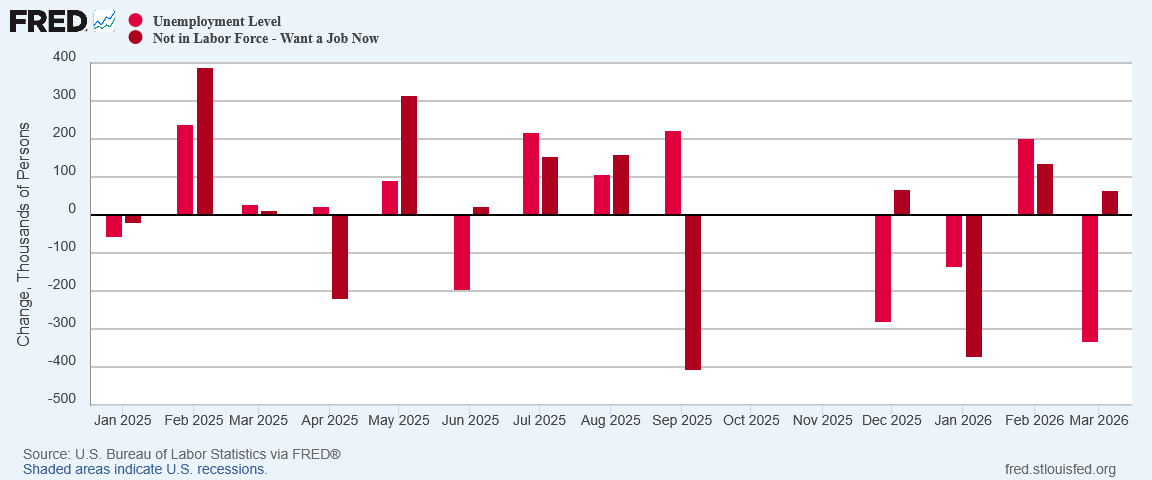
As the variance between the official and real unemployment rates indicates, there is a large portion of individuals nominally interested in working who are not being counted as part of the official unemployed—their number rose in March, and that’s never a good sign.
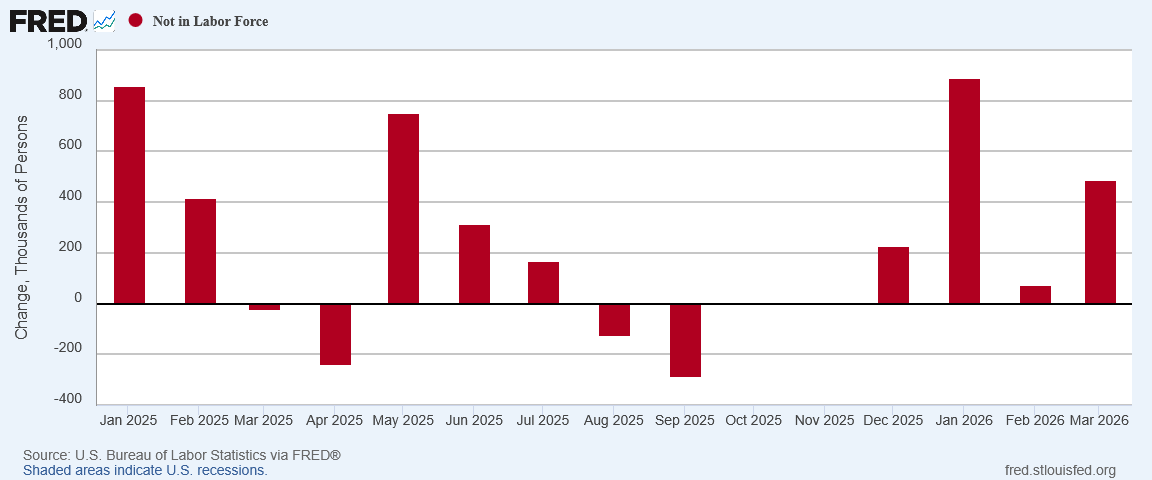
Also not a good sign is the number of workers who actually left the labor force in March, which also rose, and for the fourth month in a row.
We cannot ignore these individuals, because when people exit the labor force they are exiting jobs in many cases, but are not being counted as part of the unemployed. As the number of individuals who left the labor force in March—488,000—exceeded the drop in unemployed individuals of 332,000, can we reliably say that jobless actually declined in March?
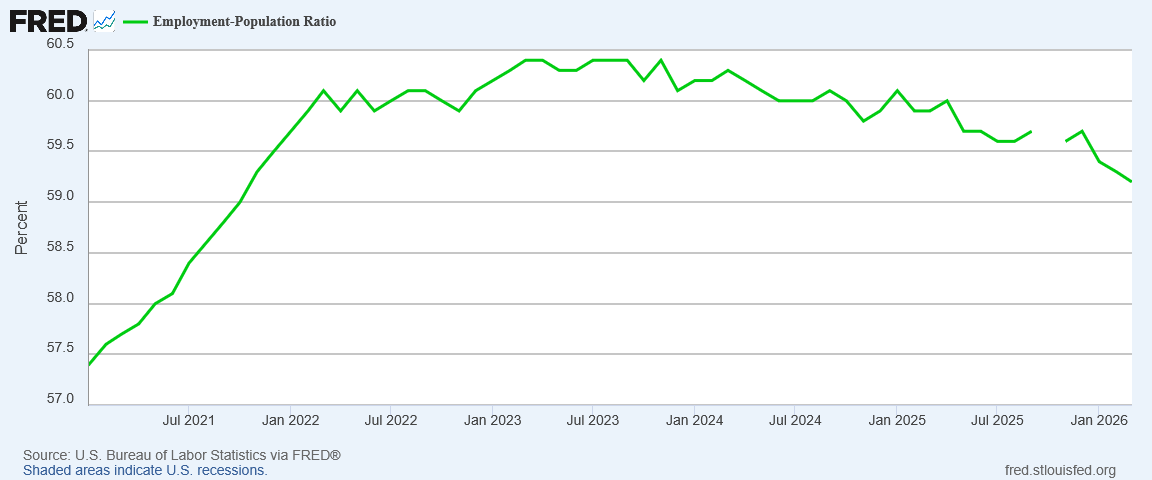
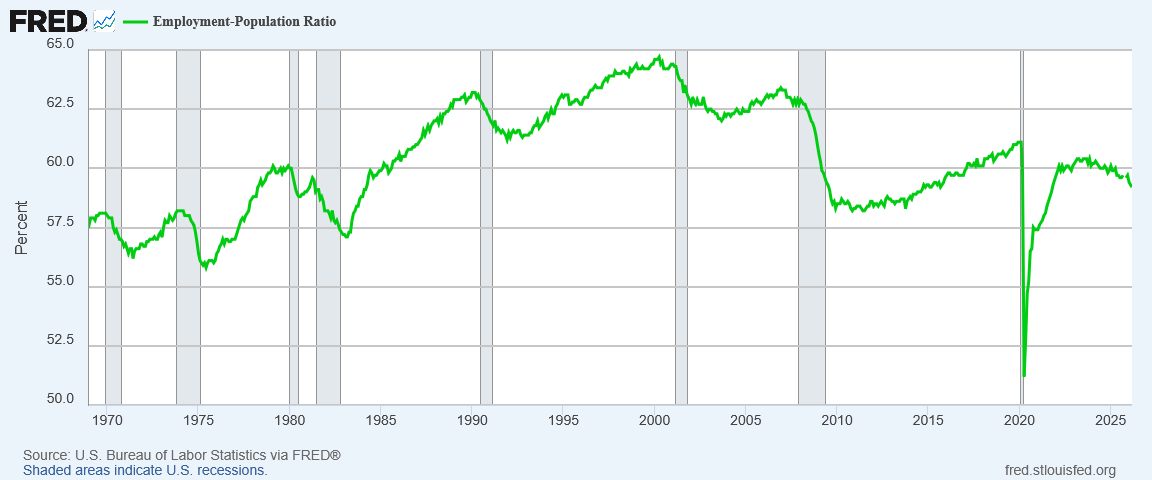
One of the reasons we can peg the start of the jobs recession to mid-2023 is that the Employment-Population Ratio began to trend down at that time. That trend has continued under President Trump, and so far in 2026 has even accelerated.
Since then the ratio has been been reduced by recession, most especially during the 2008-2009 recession following the Great Financial Crisis and the 2020 COVID Pandemic Panic. The decline since 2023 is the first time since the ratio began to be recorded after WW2 that it has declined when there was not an “official” declared recession.
When the proportion of working to non-working individuals in the population declines, there is no economic scenario in which that represents economic strength or health.
That alone is a warning sign that tells us the headline jobs numbers in the March report are far from the entire story on employment in the United States.
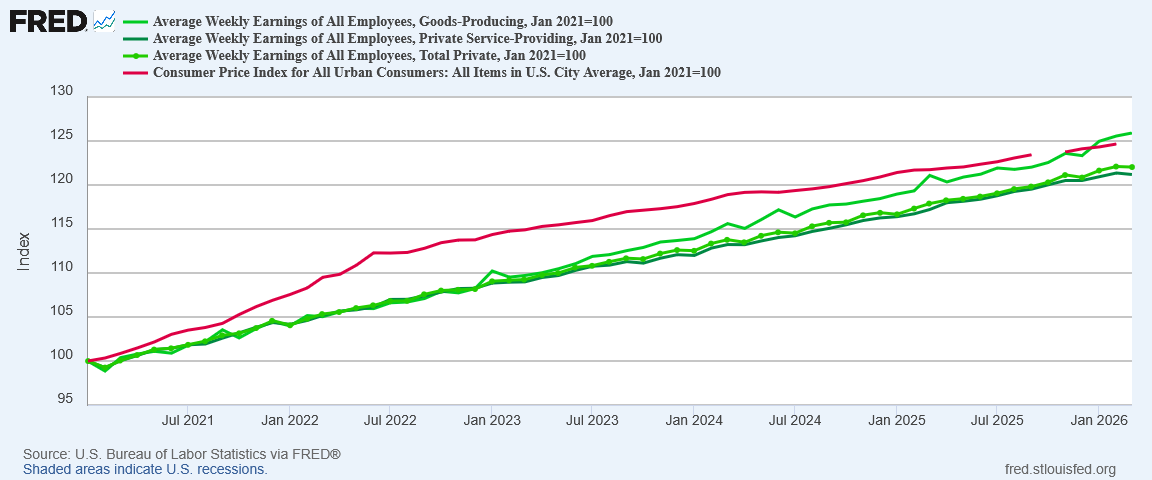
We should add a very large caveat here that the March jobs numbers come out in advance of the March inflation numbers. Goods-producing wages’ success in overcoming the 2022 hyperinflation cycle may prove to be undone by what could prove to be the start of another hyperinflation cycle.
Robust job growth is what creates upward pressures for wages and earnings. If wages are not responding to that upward pressure, we do well to question how robust the job growth truly is.
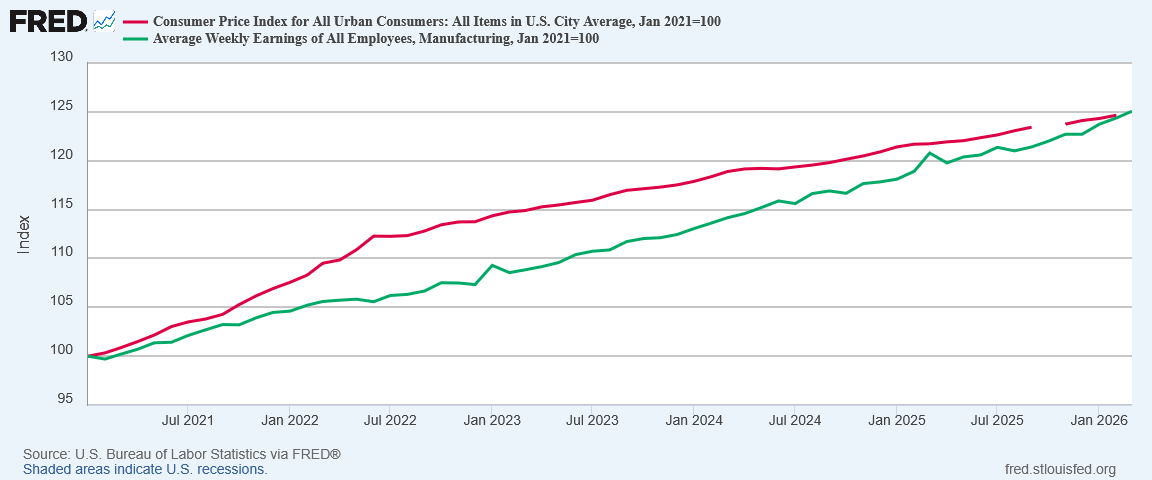
Wages are one area where job markets have not been at all equal. Manufacturing wages in particular have recently grown at rates exceeding the rate of inflation, and have been able to overcome the growth in the CPI from the 2022 hyperinflation cycle.
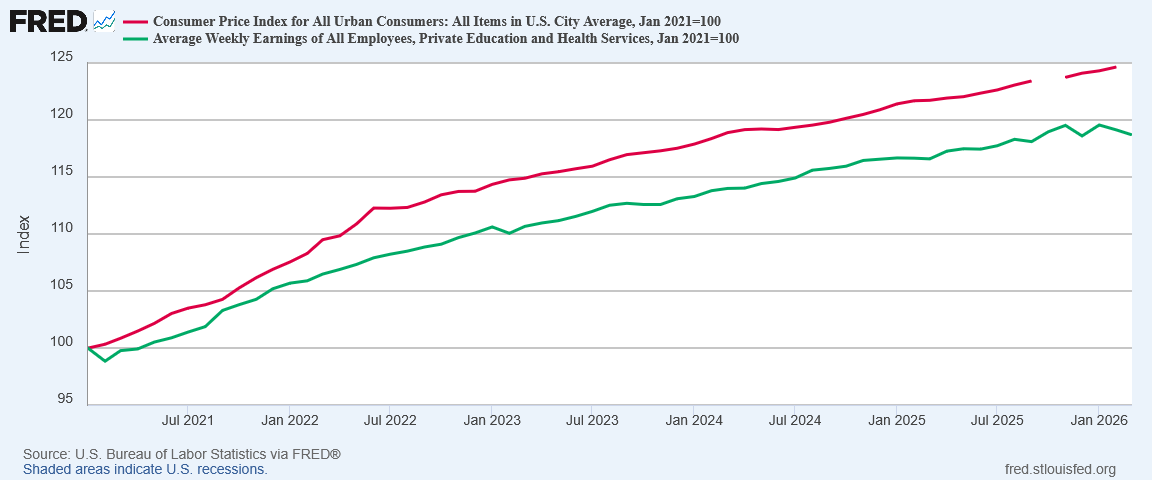
Even without the March inflation data, it is clear that in March the situation for healthcare workers relative to inflation got worse and not better.
While the Trump Administration crows about wages having risen 3.9% over the past year, the economic reality is that such an increase, is not nearly enough to recoup from hyperinflation. Until workers are made whole from that economic dislocation, the degree to which they share in Trump’s “Golden Age” remains eternally suspect, if not outright nonexistent.
With the red flags, warning signals, and weak spots within the March jobs report, it is almost certain that the headline jobs figure touted across nearly all media outlets as well as by the Trump Administration is too good to be true.
Could the reality of employment in the US for March still be largely good? Yes, it could.
While much will hinge on the magnitude of future revisions, it would take a record level of revision for all the job growth reported in March to be erased. It would take record revisions just to bring the reported job growth down to what ADP reported for the month. The red flags and warning signs tell us there are likely to be downward revisions, but to extrapolate from that a record downward revision would be pure speculation.
Without record downward revisions, we are left with job growth numbers that are still pretty good. If, as some economists suggest, the breakeven job creation rate is around 40,000 jobs per month, without a record downward revision the March job report will show solid job growth. Solid job growth, especially when balanced across most sectors of the economy, is exactly what is needed.
Yet questions must remain, particularly because of the declining employment level and declining employment-population ratio. Regardless of the reasons people are not employed, a healthy economy is when the number people employed in the economy is increasing. Regardless of the reasons people are not employed, a healthy economy is when the number of people working is increasing relative to the number of people who are not. Neither case is what we have presently, and that indicates the economy is not as healthy as many want to believe.
The March jobs report paradoxically is likely to be both too good to be true and still good, although it is impossible to tell at present whether it is good enough.
What Comes Next?
By far the biggest question, however, is the one no one can possibly answer at the moment: what comes next? We cannot say, because the key driver for the foreseeable future is the war with Iran, and the ongoing oil shock from Iran’s closure of the Strait of Hormuz.
Aside from concluding that the next evolutions of that war will be hugely economically impactful, the fog of war precludes easy extrapolations.
What history tells us is that the duration of an oil shock figures heavily in its ultimate economic impact. If the war ends quickly, and with complete reopening of the Strait of Hormuz, the economic impacts will be minimized. If Iran lashes out and does substantial damage to Persian Gulf energy production, and especially if Iran’s Kharg Island oil terminal is damaged or destroyed, the oil shock could carry on for some time, amplifying its economic impacts.
What the red flags and warning signs within the March jobs report tell us is that the United States may not be in the strongest possible economic position to deal with an extended oil shock and resulting price dislocations. As much as the prevailing wisdom from “experts” at the Federal Reserve dismiss the potential of a 1970s-style stagflation crisis, the growing magnitude of oil price and oil supply dislocations means that potential is increasing.
The question marks all revolve around oil and the refined products we get from oil, all of which are found throughout the global economy. Oil prices are up, as are those for gasoline, diesel, and all the other refined products derived from oil.
Will these costs retard labor growth, as business strive to avoid passing cost increases on to their customers? They could.
Will these costs spike consumer price inflation, with the ultimate effect of suppressing consumer demand? There will be an inflation surge of some magnitude (the March inflation data will be our first look at how great a magnitude). How much demand destruction ensues from that price surge remains a question.
So long as the war continues, so long as the Strait of Hormuz is closed, so long as Persian Gulf oil flows are disrupted, the global economy is heading into some very rough economic times. Stagflation may ensue globally, and recession is a global possibility.
No matter how one views the March Employment Situation Summary, looking ahead reduces almost entirely to the eventual outcome of Operation Epic Fury, how long before the Strait of Hormuz is reopened, and how long before normal pre-war Persian Gulf oil flows can be resumed. Whatever those outcomes prove to be are going to be far more influential on future jobs reports than any of the data presented in the March report.
What comes next for US job markets? Until the war with Iran ends, we do not know.
Every article I publish takes time, care, and independence. A paid subscription fuels that work and shields it from outside pressure. If you’re able, join me today.
You are the absolute best at making sense of conflicting data, Peter. I am impressed each time, and I think you are right in your conclusions, Magnificent Man.
The most optimistic sign in this data is finally seeing an increase in manufacturing jobs. I’ve had the sense that when Trump implemented his tariffs, he took the snow globe of the economy and gave it a good shake. The increase in manufacturing jobs indicates to me that maybe now things are settling in good ways, with new domestic manufacturing capabilities. End the war within the next two weeks and we may have a “take-off” economy.
I’m really going to celebrate when we win this war!
Somewhat related to jobs, a friend’s son is having a hard time finding an internship- he claims it’s because of AI. Including the son, only 1 of 9 have been able to find an internship this summer before their senior year. They are at a university in NYC and all accounting, finance and engineering majors so this tells me hiring is way way way down and not investing in the future.