With an increasing number of recession “red flags” cropping up in the economic data, and with even the corporate media once again discussing the possibility of recession rather than the Fed’s preferred “soft landing” narrative, it is time to examine an unusual an alarming state of affairs within Treasury markets—the persistent inversion between 1-Year and 2-Year Yields on the one hand, and 10-Year and 30-Year Yields on the other.
Yield inversions do not happen very often, and when they do they rarely happen for very long—market dynamics tend to have a self-correcting aspect to them.
We should take note, therefore, that the current yield inversion has been in place since July of 2022, and not only has not corrected itself but has increased in magnitude. What the inverted yield curves appear to say about the US economy and what they really say about the state of bond markets in the US are quite telling and more than a little disconcerting.
Like so much in the current treasury markets, the heavy and often misguided hand of the Federal Reserve is not far from the situation. The yield inversion and its persistence are both the product of Federal Reserve mishandling of monetary policy and its balance sheet.
Before considering the current inverted yield curve, a bit of background is in order.
The “yield curve” is the spectrum of interest rates charged for different maturities within a particular type of debt security—in this instance, US Treasury debt. Normally, longer maturities command a higher interest rate, and shorter maturities command a lower interest rate1.
Occasionally, however, the reverse phenomenon emerges, and shorter maturities command a higher interest rate than longer maturities.
From an economic perspective, an inverted yield curve is a noteworthy and uncommon event because it suggests that the near-term is riskier than the long term.
As a basic premise of investing, it is generally irrational for the near term to be riskier than the long term. The greater span of time in the long term inherently means greater uncertainty and therefore greater risk, which generally translates into an higher yield.
To understand why there is generally a direct correlation between risk and interest, let us look at the concept of Net Present Value2.
Net Present Value is simply the difference between the value of a cash inflow (or outlay) today and a cash outflow (or inflow) some time in the future. The general formula for calculating Net Present Value is as follows:
Underpinning the concept of Net Present Value is the concept known as the Time Value of Money3:
The time value of money (TVM) is the concept that a sum of money is worth more now than the same sum will be at a future date due to its earnings potential in the interim. The time value of money is a core principle of finance. A sum of money in the hand has greater value than the same sum to be paid in the future. The time value of money is also referred to as the present discounted value.
Similar to Net Present Value, the Time Value of Money can also be expressed as a formula:
With a little application of algebra, we can take this equation and easily solve for either the present or future value of a sum of money. However, the most important understanding here is that money in hand today is worth more than money in hand tomorrow, and money in hand tomorrow is worth more than money in hand next month or next year.
Net Present Value and the Time Value of Money are what drive the market dynamics behind various interest rates, including Treasury yields. In order for a particular Treasury issuance to be a compelling investment option, the interest rate (AKA the discount rate) has to be sufficient to make the Net Present Value attractive. This is also why Treasury yields and Treasury prices move in opposite directions—conceptually, the Treasury price is the NPV of the issuance, and the higher the interest rate “i” is set the lower resulting NPV calculation.
Because levels of uncertainty increase as time increases, the compelling Net Present Value of longer term Treasuries has to be smaller than that for shorter term as compensation for the risk that uncertainty entails. Thus the interest rate must increase.
Since summer of 2022, however, the compelling Net Present Value for longer term Treasuries has been greater than that for shorter term Treasuries, producing an inverted yield curve.
An inverted yield curve is an abnormal state of affairs that traditionally indicates something is wrong in the economy. In normal times, bonds with longer maturities have higher yields than those with shorter terms because investors want to be compensated for the uncertainty of a longer-term investment. When the opposite is true, it indicates that investors are betting on a downturn in the near future.
“When long rates fall below short term yields, that has historically been a fairly good guide to recession risks ahead, better, it’s often noted, than the track record of my own economics profession,” Avery Shenfeld, chief economist at CIBC Capital Markets, wrote in a commentary last week. “The only recession it failed to clearly signal was the 2020 COVID shock, which came on too suddenly, and from a non-economic source.”
In other words, investors are expecting worse economic performance over the next one to two years than they are expecting over the next 10 to 30 years—a pretty dour outlook on the future!
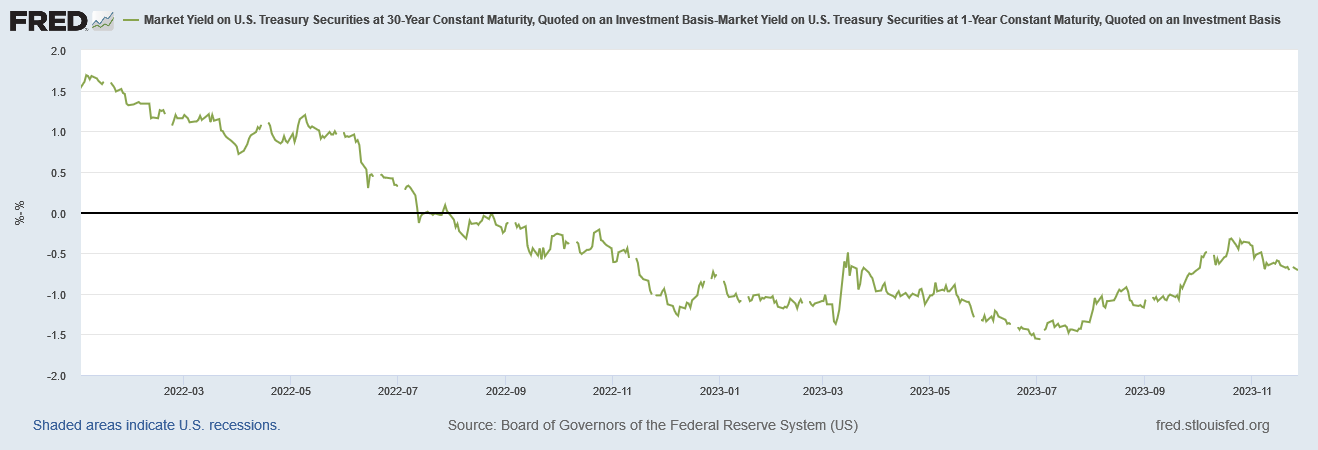
Yet at this juncture the situation is even more remarkable, because the inverted yield curves for both 10-Year and 30-Year Treasuries have lasted for more than a year.
The inversion between the 10-Year Treasury and the 1-Year Treasury began on July 12, 2022:
The inversion between the 30-Year Treasury and the 1-Year Treasury began a day later, on July 13:
In other words, financial markets have been betting against the short-term performance of the US economy for longer than the maturity period of the short-term security under scrutiny. Yet, at least according to the official data, the US economy has managed to grow throughout 2022 and thus far in 2023.
The financial markets have been betting on the US entering a recession since July of 2022, and the data says that was a losing bet. Yet the yield inversion remains, as the markets have not corrected.
What is going on here?
As early as September of 2022, certain portions of the corporate media have commented on the inverted yield curve, pondering its potential as a recession predictor.
Does an inverted yield curve indicate that a stock market drop and economic strife is coming? Very honestly, there is merit to this idea. In fact, an inverted yield curve has accurately predicted the ten most recent recessions.
With that said, the yield curve doesn't cause downturns. Instead, it represents how investors see the trajectory of the U.S. economy. If people believe a slump is imminent, they will rush to buy long-term U.S. bonds.
When there are many buyers of long-term treasuries in a short time, the yield drops. Since there is less demand for shorter-term treasuries, the yield increases. The Federal Reserve also plays a part here. Short-term bonds will increase their yields if they begin to raise interest rates. This will naturally flatten the yield curve as the yield on longer-term bonds stays the same.
The prevailing explanation even as late as July of this year has been that a recession will force the Fed to lower rates, thus making a bet on lower-yielding 10-Year Treasuries a reasonably safe bet—or so the prevailing market wisdom goes.
The yield curve inverts when shorter-dated Treasuries have higher returns than longer-term ones. It suggests that while investors expect interest rates to rise in the near term, they believe that higher borrowing costs will eventually hurt the economy, forcing the Fed to later ease monetary policy.
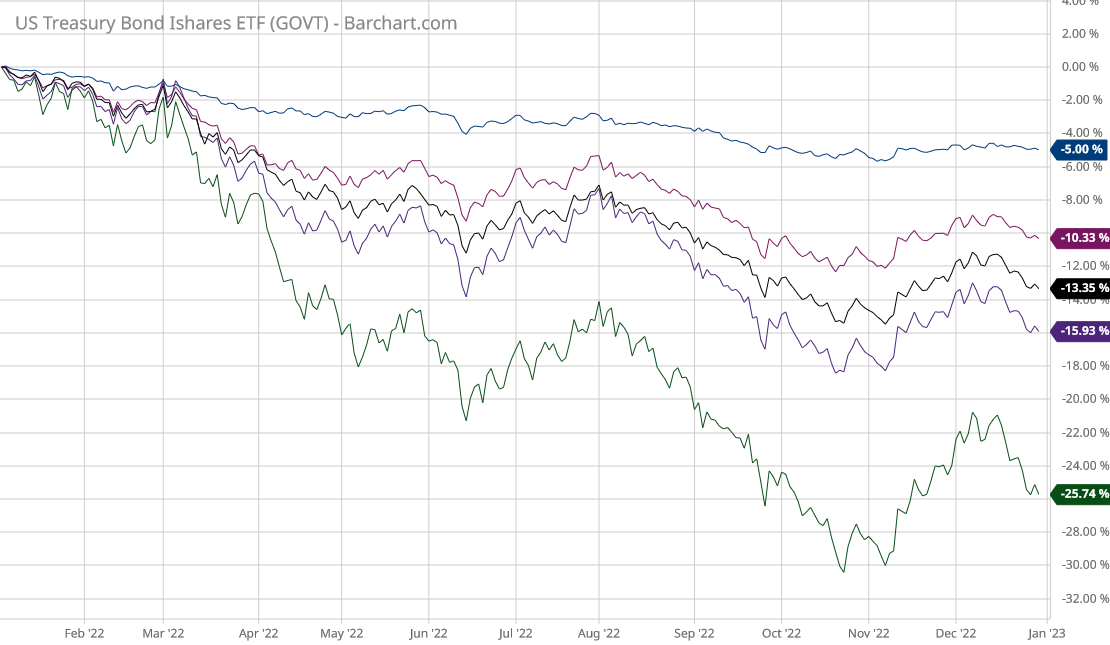
However, this view does not reconcile to even the 2022 performance of Treasuries in the marketplace. When we look at the performance of Exchange Traded Funds focused on government securities we see that the longer term bonds hemorrhaged value, while the shorter term bonds held comparitively greater value (i.e., they lost less).
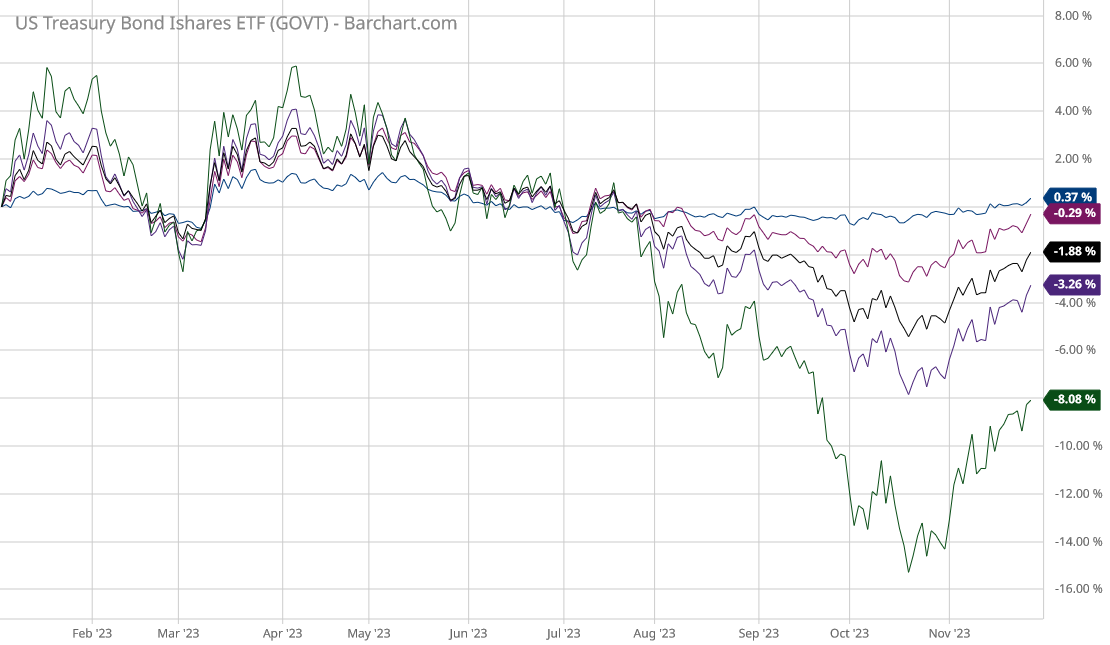
Even for the first eleven months of 2023, longer-term bonds have performed horribly as an investment relative to shorter-term bonds.
Even if we accept the interpretation of the yield curve inversion as a leading indicator of a coming recession, a “flight to safety” reaction shifting investment from short-term to long-term bonds would only make sense if those long-term bonds outperformed as an asset class, and they have not. If anything, the “flight to safety” should be out of long term bonds and into short term bonds in order to preserve investment capital.
Moreover, the financial media has begun commenting on this bear market for bonds, and for the longer-term bonds especially.
Nobody wants U.S. Treasury bonds.
Once a symbol of America’s economic might and accepted as a global coin of the realm, they have fallen badly out of favor, with serious consequences for taxpayers, investors, and financial markets.
Elementary economic forces — too much supply and not enough demand — have collided to create the worst stretch for U.S. government bonds since the Civil War. The government keeps borrowing to cover its budget deficits, while once-reliable buyers of that debt, both at home and abroad, have pulled back.
Not only are markets apparently super-saturated with US government debt, but the demand for 10-year and 30-year Treasuries is especially weak.
“There’s just a lot less demand than there was even six months ago,” Goldman Sachs’ Jim Esposito said last week. “You can buy a 6-month T-bill that’s yielding north of 5%. Why wouldn’t you buy that instead of a long bond that’s yielding 4¾?”
However, even this view is at odds with some key pieces of data—term interest rates themselves. Even if we accept the initial position of short term yields being higher than longer term yields, money flowing into short-term securities and out of longer-term securities should push down short-term yields and prop up longer-term yields. That has not happened in 2023.
Not only is the irrational yield curve inversion persisting, yields are not behaving as the markets suggest they should, trending towards an equilibrium condition and resolving the inversion.
Thus we return to the same question as before: What is going on here?
One thing we must admit at this point is that the current yield curve inversion is not serving as rational bellwether of a coming recession to Wall Street. For reasons all its own, Wall Street by and large does not consider the US economy to be in recession, even though the recent Consumer Price Index and Producer Price Index data strongly suggest that we are in a recession.
Not only has the yield curve persisted for far too long for it to be a rational bellwether of a coming recession, but the market behavior surrounding both short and long term Treasuries just does not reconcile to Wall Street treating the inversion as a rational bellwether of a coming recession.
There must be another reason for the inversion.
And indeed there is: The Federal Reserve and their scheme of monetary “tightening”.
We already know that the Fed has been steadily shrinking the money supply since early 2022.
We already know that the Fed has been steadily trimming its balance sheet, shedding its holdings of US government debt.
Under normal conditions, these reductions would produce continued upward pressure on interest rates, and we would be seeing a steady rise in interest rates across the yield curve—a reality which should have crashed bond markets by now.
However, these conditions are anything but normal, because while the Federal Reserve has been rolling off its US debt holdings, it has been doing so only with its shorter term holdings.
The Treasuries on the Fed’s balance sheet with a maturity greater than 10 years have continued to increase. There has been no decrease.
Keep in mind that the Fed purchasing US Treasuries is going to drive down the yield and drive up the price. The Fed has continued to add to its holdings of long-term Treasuries, thus supporting the market for longer term treasuries, suppressing yields while raising prices.
The reverse is also true, but for short term securities. By reducing its holdings of short-term Treasuries, the Fed has been steadily undermining the market, boosting yields while suppressing prices.
Analysts are quite willing to expound at length about inverted yield curves. What does a perverted yield curve tell us?
What we are forced to conclude is that the Federal Reserve, by putting its thumb on the scale for the prices of some Treasuries but not others, has indeed perverted the US Treasuries market. The demand picture has been intentionally skewed, with the Fed emphasizing the softening of demand for short term Treasuries while obscuring it for long term Treasuries.
What we are also forced to conclude is that the current yield curve inversion is nothing more than an artifact of the Fed’s selection of which Treasuries to support and which to not support. Even the extent to which the market yields for 10-Year and 30-Year Treasuries has risen over the past two years can be traced to the actions of the Fed, and its slowing of 10-Year and 30-Year Treasury purchases from 2021 through 2022 and into the current year 2023—even just easing up on such purchases has proven enough to reveal the actual softness of demand for US Treasuries in the marketplace without the Fed to sop up all the excess supply.
As a direct consequence of the Fed’s manipulations of Treasury markets, the current yield curve inversion is not likely to resolve itself any time soon. So long as the Fed continues to purchase longer term Treasuries and not shorter term ones, longer term yields will continue to be pushed below shorter term yields. The one scenario where this would not be the case is where the government issues so much new debt that even the Fed is no longer soaking up the excess supply, at which point longer term yields would rise rapidly.
The yield curve inversion also means the Fed is talking out of both sides of its collective mouth on interest rates. It has been talking up interest rates as a means to corral consumer price inflation, yet the Fed is the entity which has been holding longer term Treasury yields below short term Treasury yields.
Moreover, it is abundantly clear the lever the Fed has been using to influence interest rates is not the federal funds rate but its balance sheet. Market interest rates are being set by the Fed’s willingness (or unwillingness) to absorb the excess supply of Treasuries.
Where does this leave the market for US Treasuries? It leaves the market in a state of complete dysfunction. The Fed is completely short-circuiting the normal market mechanisms for setting prices—and doing so as a part of a proclaimed strategy to regulate normal market mechanisms for setting prices. That is a level of hypocrisy and cognitive dissonance that cannot possibly end well for anyone.
With normal market pricing mechanisms effectively placed in abeyance, the Fed is effectively devaluing US Treasuries, and we already know how that must end. When markets cannot place a proper value on any product, even an issuance of debt, the market value of that product effectively becomes zero.
When the markets finally make that realization about US Treasuries, “bond crash” will not even come close to describing the chaos that will follow.
McWhinney, J. “The Impact of an Inverted Yield Curve.” Investopedia, 2023, https://www.investopedia.com/articles/basics/06/invertedyieldcurve.asp.
Fernando, J. “Net Present Value (NPV): What It Means and Steps to Calculate It.” Investopedia, 2023, https://www.investopedia.com/terms/n/npv.asp.
Fernando, J. “Time Value of Money Explained with Formula and Examples.” Investopedia, 2023, https://www.investopedia.com/terms/t/timevalueofmoney.asp.


