No Change In The CPI. Is This Stagflation Or Deflation?
Cause For Consternation, Not Celebration.
The October Consumer Price Index Summary printed below expectations for both the month on month and year on year percentage changes.
The Consumer Price Index for All Urban Consumers (CPI-U) was unchanged in October on a seasonally adjusted basis, after increasing 0.4 percent in September, the U.S. Bureau of Labor Statistics reported today. Over the last 12 months, the all items index increased 3.2 percent before seasonal adjustment.
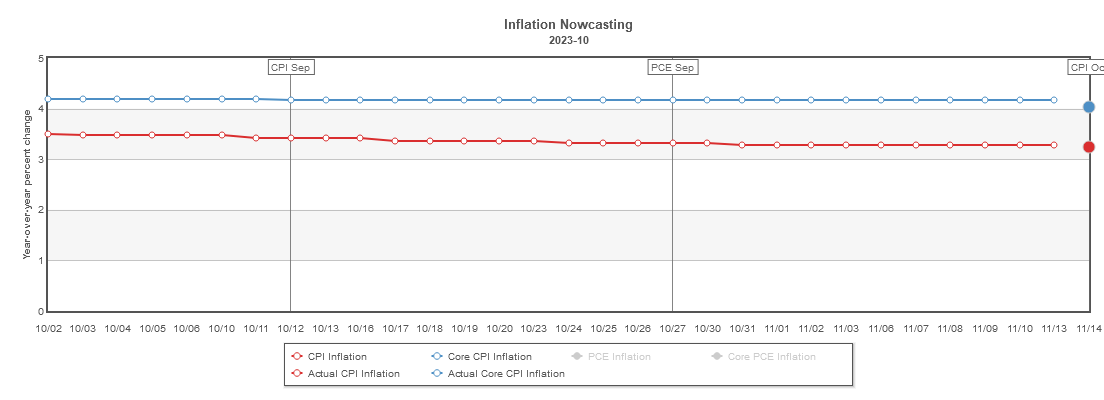
Core inflation (headline CPI less food and energy) printed noticeably lower than what the Cleveland Fed’s InflationNow nowcast projected.
The usual bevy of “experts” had projected inflation to come in slightly higher than what the Bureau of Labor Statistics reported.
Economists had expected prices to increase 0.1% month-over-month and 3.3% year-over-year, according to data from Bloomberg.
What do we make of this unexpected lack of CPI growth? Has inflation been tamed at long last?
More likely, the data is illustrating how the US economy is continuing to soften and continuing to slip farther and farther into recession. Whether the future trend is towards stagflation or chronic deflation is still a question, but neither outcome represents good news.
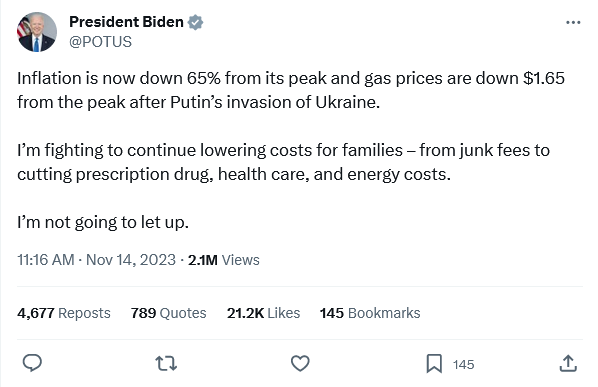
Dementia Joe’s handlers, of course, could not resist crowing about the much-improved headline inflation rate.
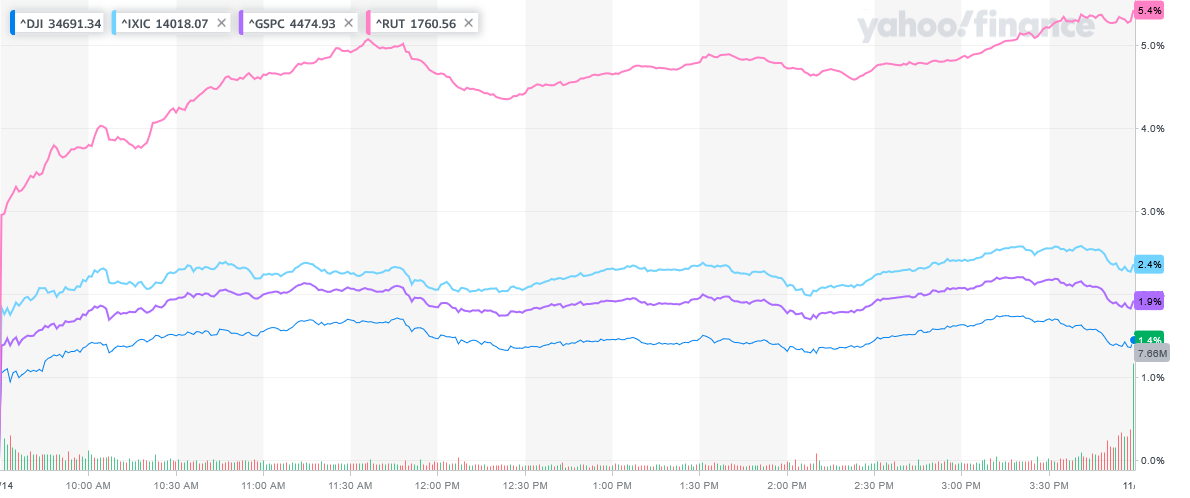
Wall Street was suitably pleased, with equities rising on the day.
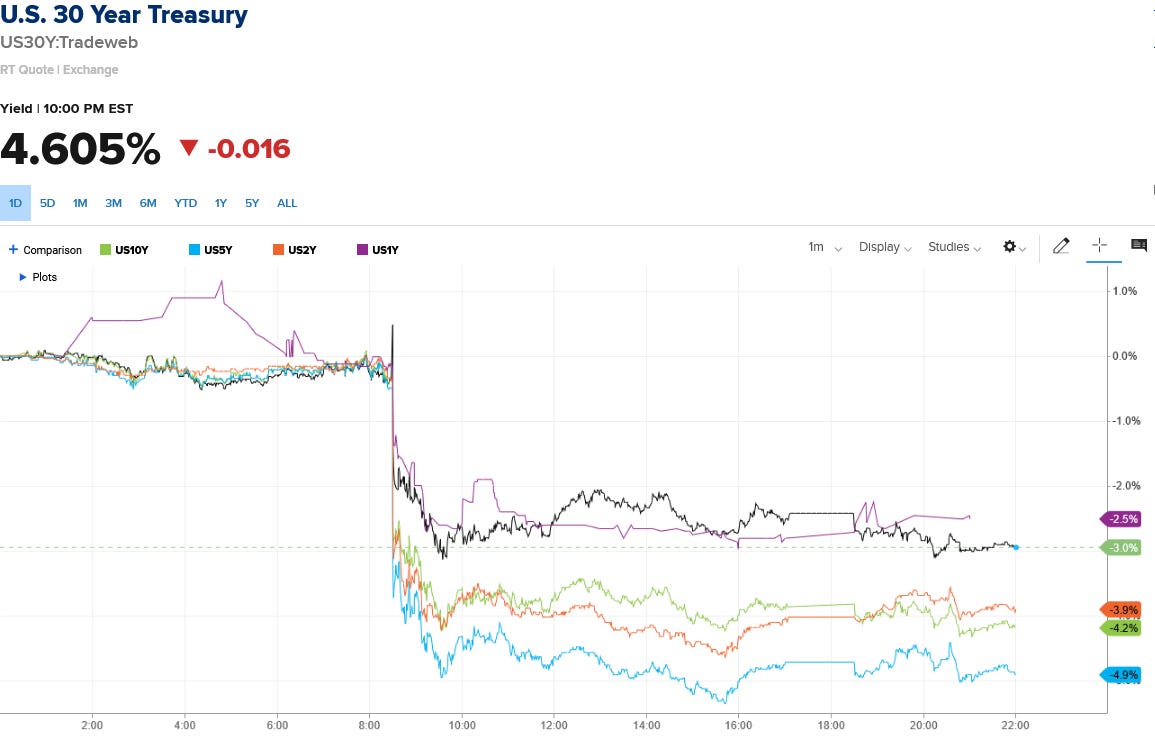
Treasury yields also responded favorably, dropping straightaway after the CPI data was announced.
The numbers certainly look good. What could possibly be wrong with them?
The answer, of course, begins with those declining Treasury yields. With the Fed’s overall tightening of monetary policy and shrinking of the money supply, that yields can continue to fall indicates a shrinking level of loan demand, which can only mean an economic contraction is upon us, magnitude as yet indeterminate.
That the October print came in low is surprising, given that September’s print came in above what was expected.
The October inflation data, however, is not showing the growing stagflation that reverberated throughout the September report.
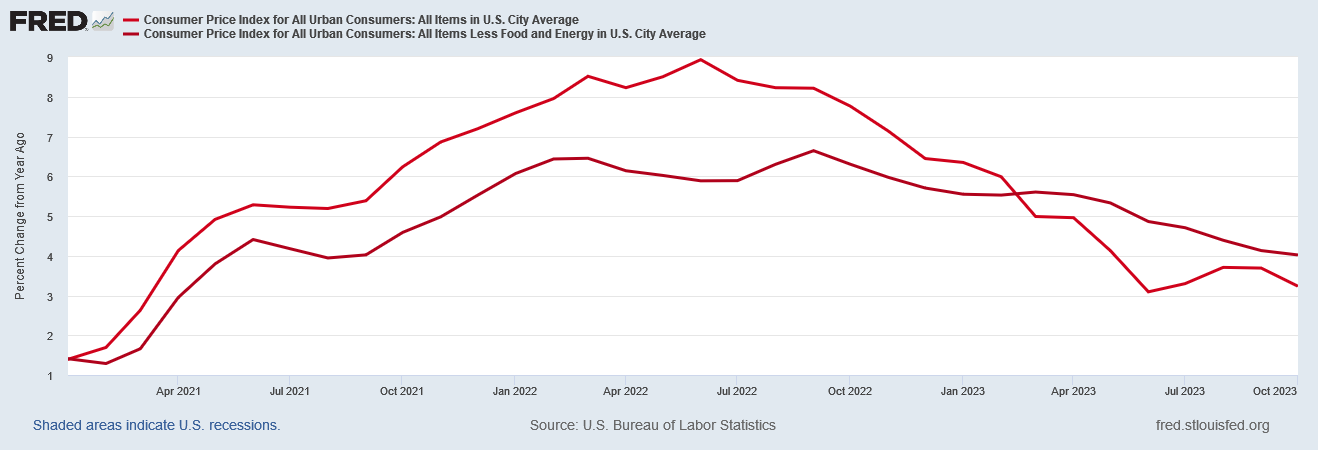
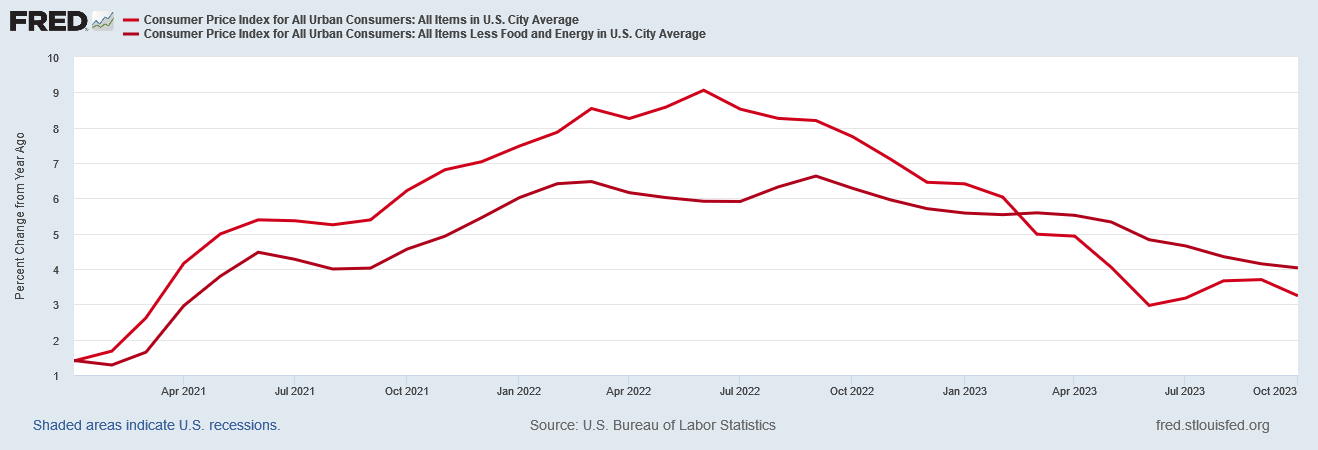
For starters, the seasonally adjusted year on year inflation rate declined significantly from September.
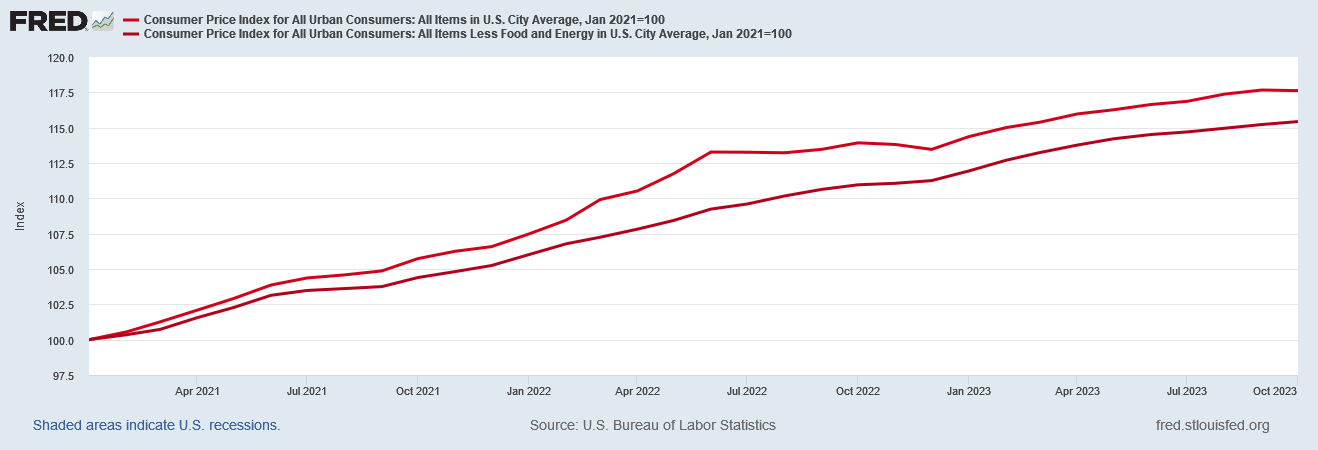
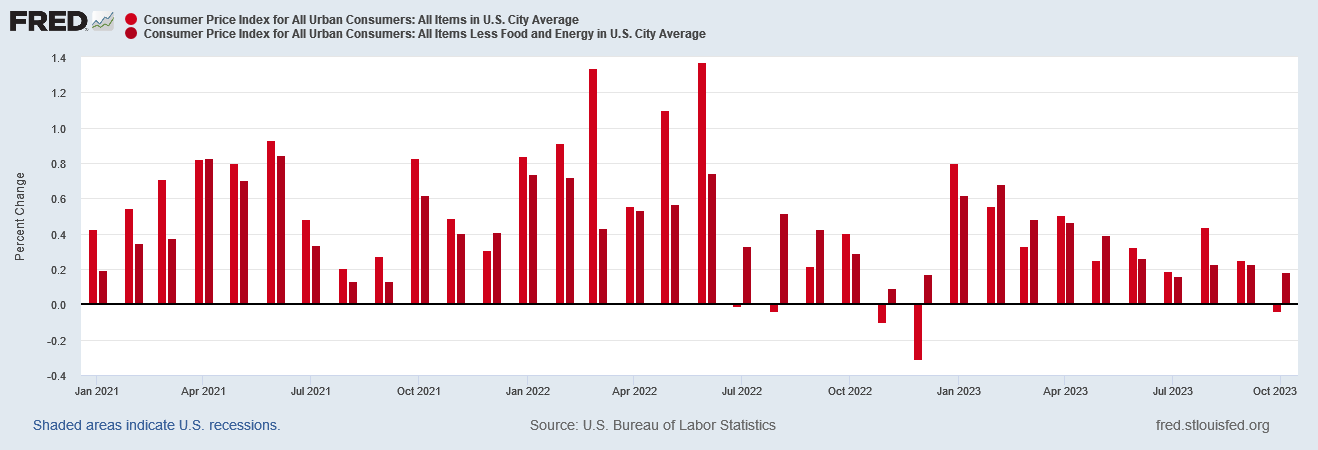
What is more significant, however, is that on an unadjusted basis, the Consumer Price Index itself actually declined ever so slightly. October was a month of outright deflation according to the unadjusted headline CPI.
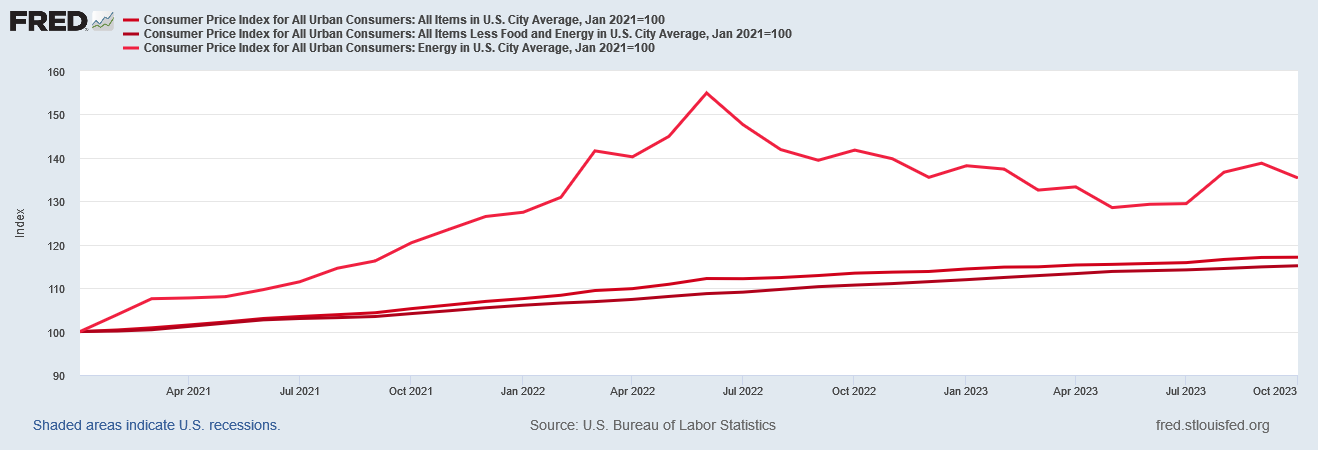
The “core” CPI less food and energy still continued to rise at a nearly linear rate, but the headline metric effectively halted for the month of October.
When we look at the year on year percent change in the unadjusted data, we see largely the same declines that we see in the seasonally adjusted data. This precludes seasonal adjustments from being used to obscure shifts in the unadjusted data.
Viewed month on month, the core inflation rate is still broadly consistent with a trend of rising inflation in recent months, although it is clear that headline inflation has once again softened considerably, and is in actual deflation for the month of October.
The variance between headline and core consumer price inflation is of course attributable largely to continued softness in energy markets, resulting in renewed energy price deflation.
Although energy prices are still up significantly from the start of Dementia Joe’s Reign of Error, compared to the months immediately prior, they are declined again in October.
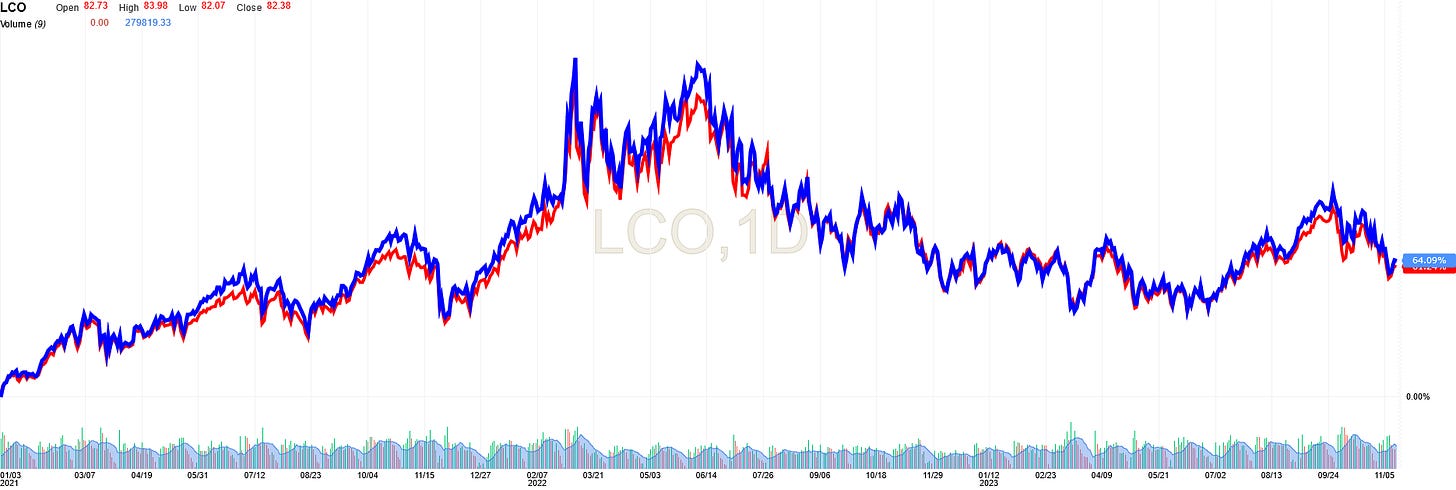
We can have confidence in the trends being reported by the BLS on energy prices, as the subindex within the CPI for energy broadly shares the same basic curve as the prices for crude oil.
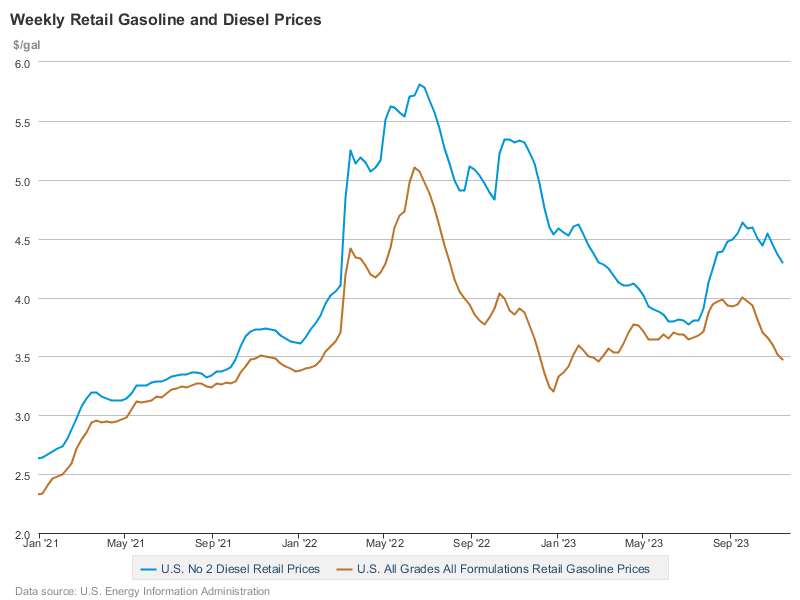
Even retail gas and diesel prices within the US show the same broad trends of increase and decreated over the same time period.
Most, if not all, of the past eighteen months of energy price inflation has abated, and the Consumer Price Index is showing the impact of that abatement.
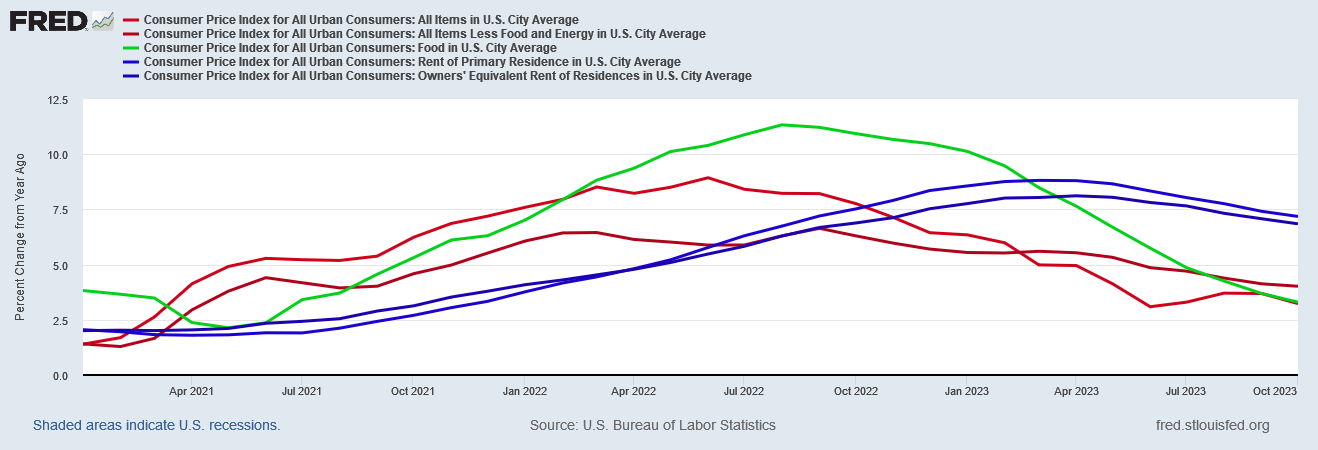
Nor is energy the only aspect of the Consumer Price Index that has seen broad improvement over the past several months. Food and shelter have been showing increasing disinflation throughout 2023.
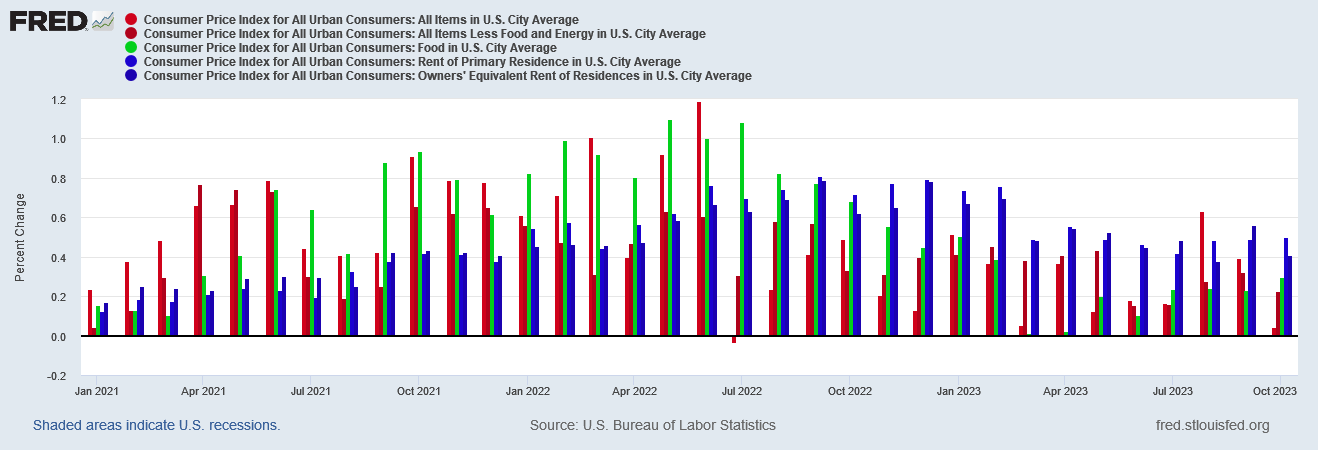
We can also see that food price inflation has, month on month, become far less significant to overall inflation than shelter, starting as far back as last summer.
Shelter price inflation month on month has not dropped significantly in the most recent three months, however, indicating that shelter price inflation may be stabilizing at a rate that is significantly higher than it was prior to 2021.
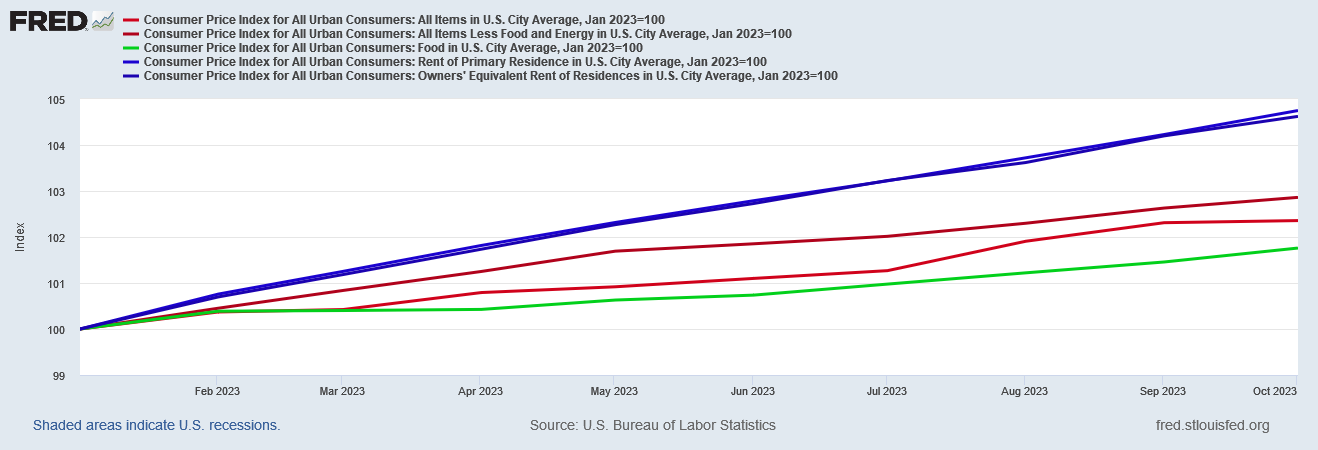
If we baseline the food and shelter subindices to January of this year, we can see clearly that shelter has become far more influential within the Consumer Price Index than food.
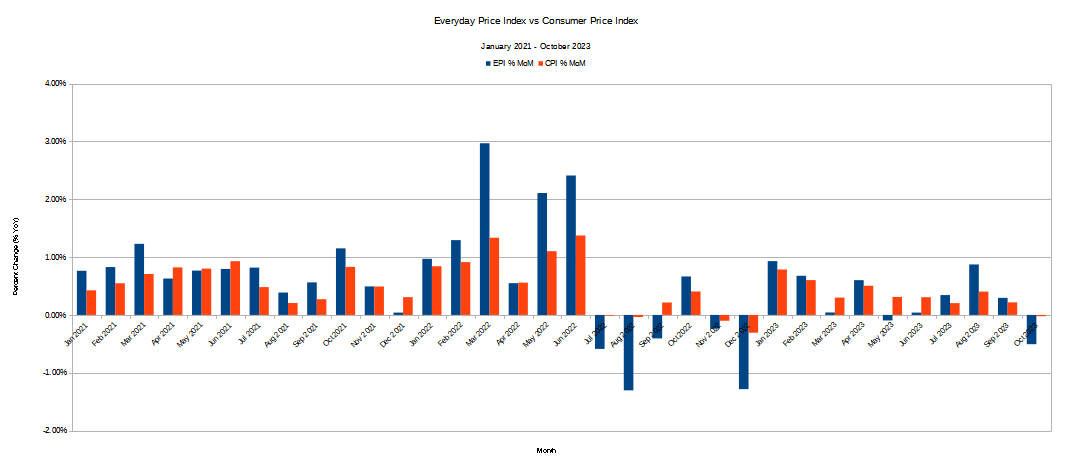
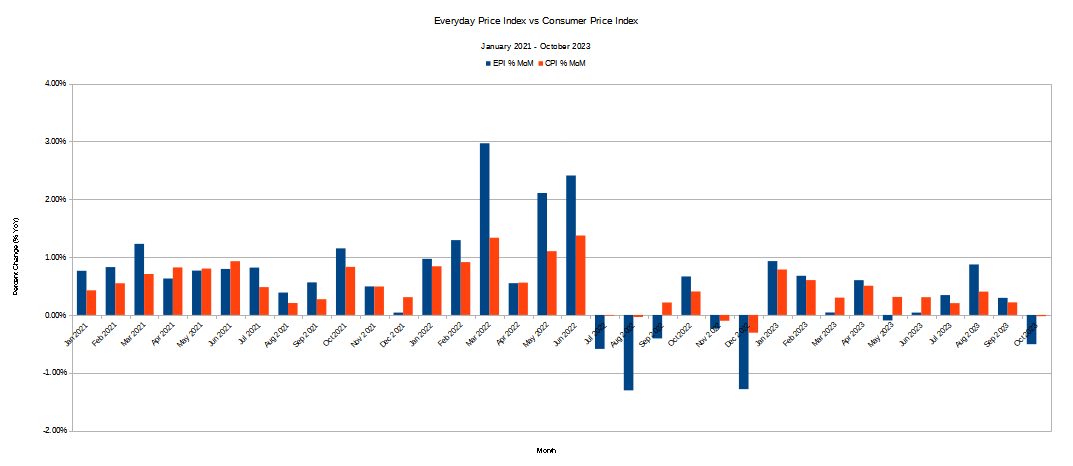
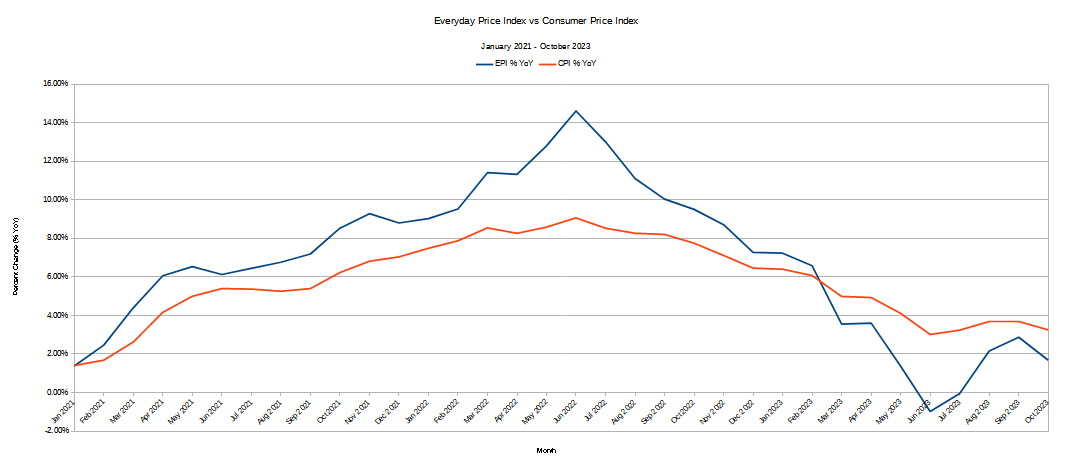
However, the strongest signals of significant easing within consumer prices more broadly comes not from the CPI, but from the privately maintained Everyday Price Index published by the American Institute for Economic Research. As the chart at the beginning of the article illustrates, the EPI is showing significant deflation month on month for October.
Even year on year, the EPI has recorded deflation twice in 2023.
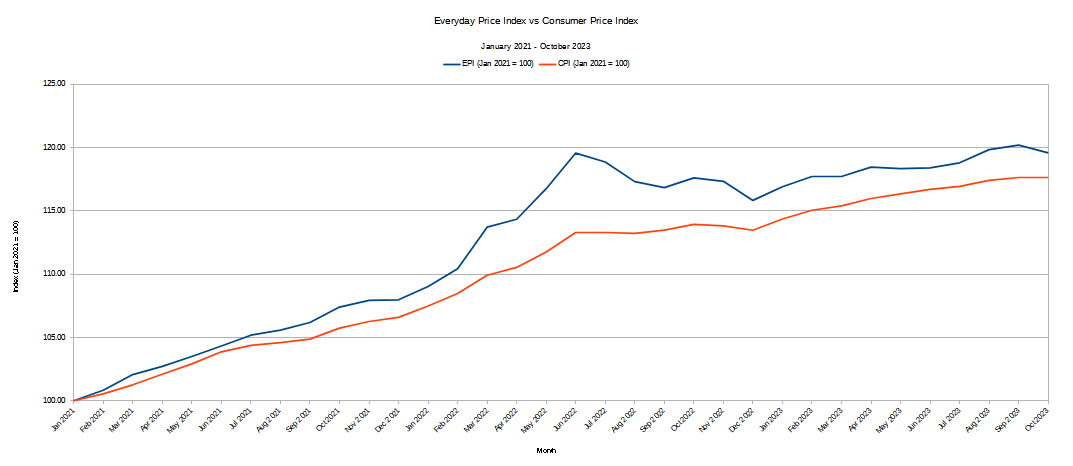
When we look at the overall Everyday Price Index itself we see there was an extended period of consumer price deflation beginning in June 2022, when energy prices peaked.
The EPI itself is further confirmation that energy demand overall has been substantially softer than generally assessed, and that in turn implies that overall consumer demand is far weaker than generally assessed.
On its own, this data would be welcome news, for it signifies that inflation is at the very least not growing significantly. It may also signify broad consumer price deflation is developing—something that most consumers would greatly desire, all else being equal.
The dilemma in this data comes from things that are happening outside of the shifts in consumer prices.
Interest rates have been easing in recent weeks, despite the fact that the Federal Reserve is continuing to tighten its monetary policy, thereby shrinking the money supply.
At the same time, jobless claims have been trending up in the US, in direct contradiction to the corporate media narrative of a strong and robust jobs market.
Additionally, oil markets continue to show growing weakness, even in the face of the latest round of war between Israel and Hamas, and despite the multiple production and export curbs that Russia and Saudi Arabia have imposed in an effort to bolster the price both of crude oil and various refined products.
Both domestically and globally, the indicators of a growing and deepening economic slowdown are accumulating. Global recession arguably is not merely a possibility, but is happening even now, and has been happening for quite some time.
Broadly based consumer price deflation, where demand for goods and services recedes throughout an economy, is exactly the outcome these recession red flags would be expected to produce. Broadly based consumer price deflation is what is potentially beginning to set in for several parts of the US economy.
Wall Street wants to believe that October’s inflation data represents a slice of economic good news. If there were not multiple and accumulating signs of economic weakness from literally every direction, perhaps the inflation data would be a slice of economic good news.
Unfortunately, there are multiple and accumulating signs of economic weakness from literally every direction, which means October’s inflation data is ultimately a slice of dangerous economic news and potentially very bad economic news. It is cause not for celebration but for consternation.
Recession is upon us, and is getting worse, not better.




Thank you, Peter!
You are thouroughly convincing, but I think recession may yet be avoided, if only because the Democrats need (real) voters.