In September factory gate inflation rose at the fastest pace in months.
Last month factory gate inflation became the biggest slice of factory gate deflation in years.
The Producer Price Index for final demand fell 0.5 percent in October, seasonally adjusted, after advancing 0.4 percent in September, the U.S. Bureau of Labor Statistics reported today. (See table A.) The October decline is the largest decrease in final demand prices since a 1.2-percent drop in April 2020. On an unadjusted basis, the index for final demand rose 1.3 percent for the 12 months ended in October.
Corporate media, in keeping with the “no, we’re not in a recession” narrative, saw the declines as a relief from the inflationary pressures of the past couple of years.
U.S. producer prices fell by the most in three-and-a-half years in October amid a sharp drop in the cost of gasoline, the latest indication of subsiding inflation pressures.
Rather than worry about the potential significance of the decline in factory gate prices, corporate media would prefer simply to focus on the headline, which is that prices are coming down.
Wholesale prices in October posted their biggest decline in 3½ years, providing another indication that the worst of the inflation surge may have passed.
However, coupled with Tuesday’s Consumer Price Index Summary, the Producer Price Index is showing signs that demand is weakening across entire economic sectors.
These are not good signs for the economy.
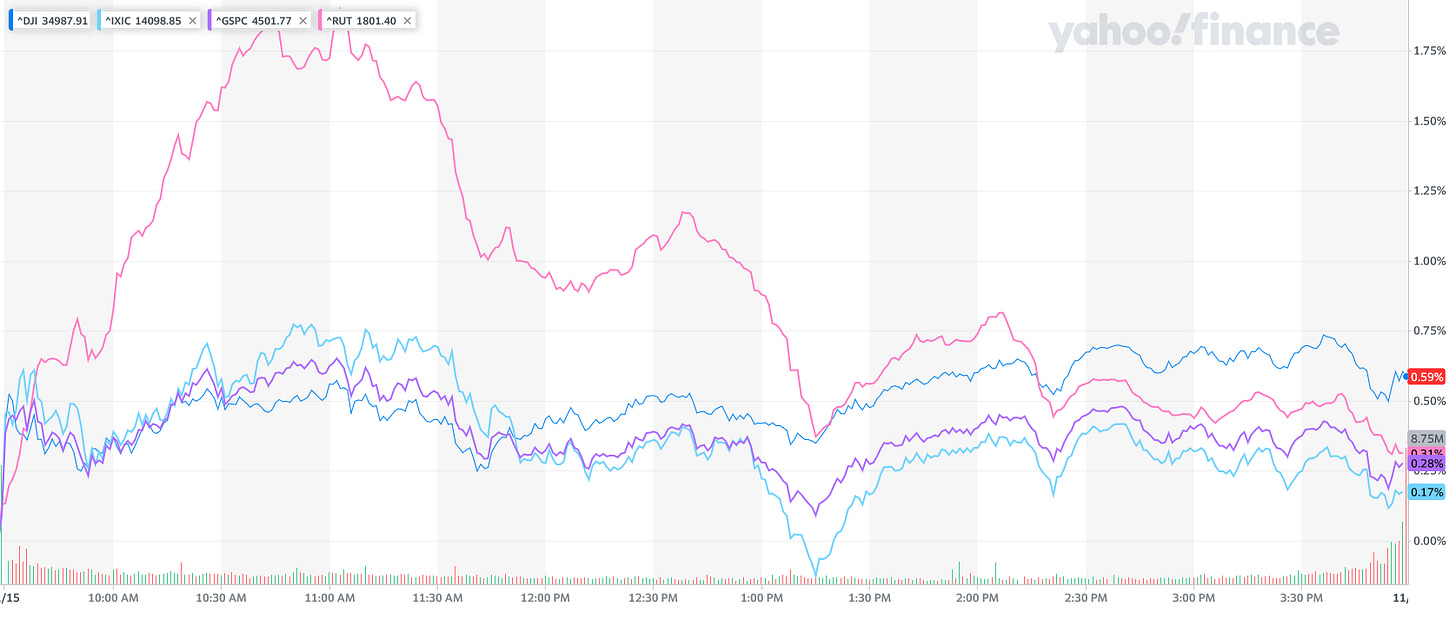
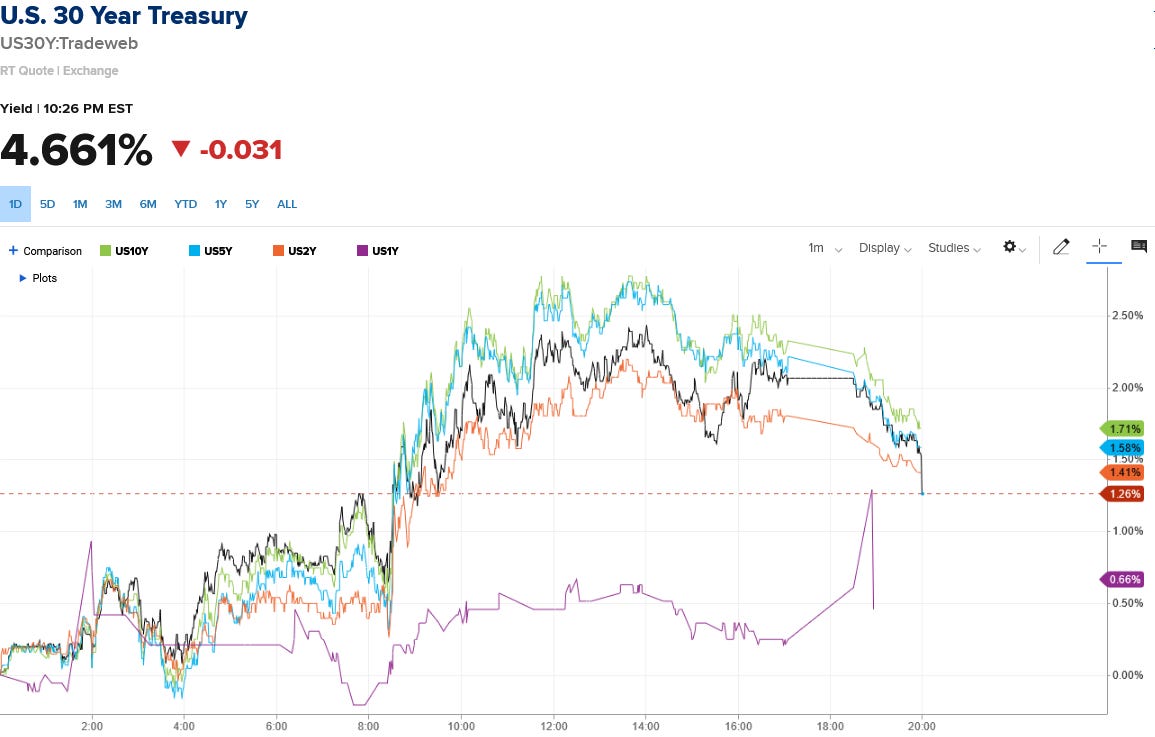
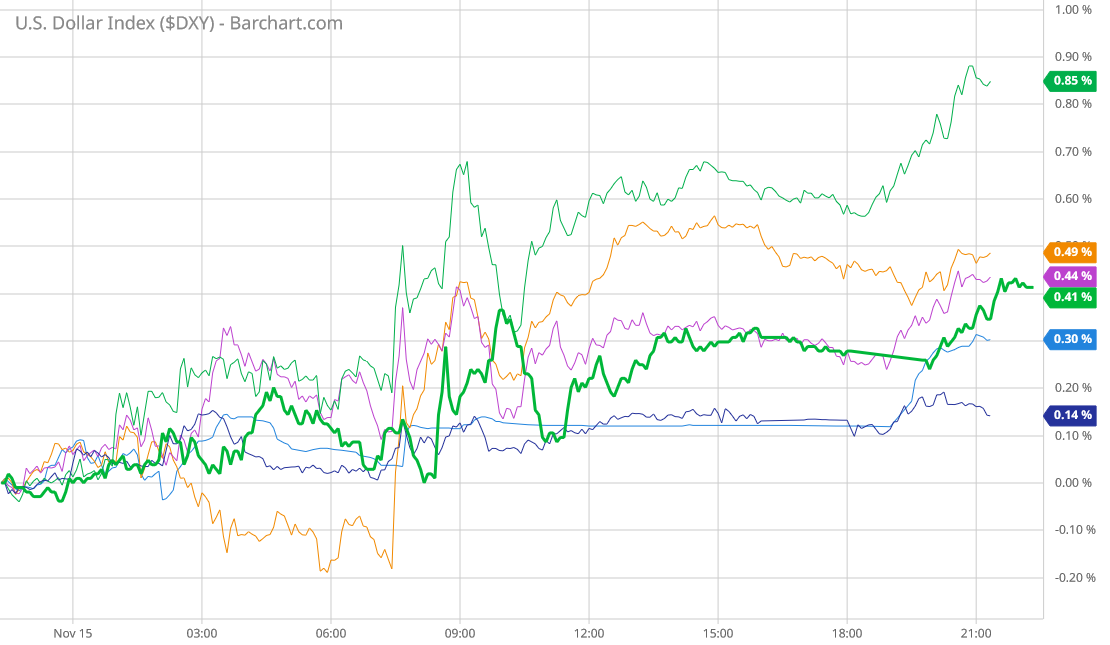
Wall Street’s reactions yesterday’s PPI numbers were muted but mixed.
On the one hand equities inched up a little on the day yesterday.
On the other hand, Treasury yields also inched up—the typical “we’re not happy” reaction from financial markets.
The dollar sided with equities and moved up marginally.
On balance, Wall Street had a good trading day, and one without any major bloodbaths. Whatever bad news might lie in the Producer Price Index Summary, Wall Street certainly is not seeing it.
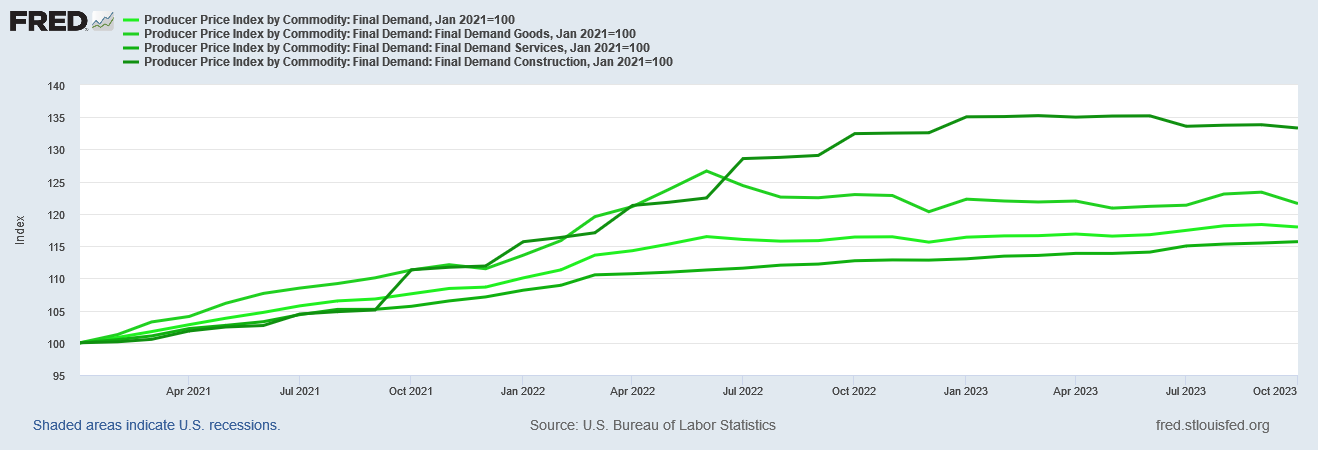
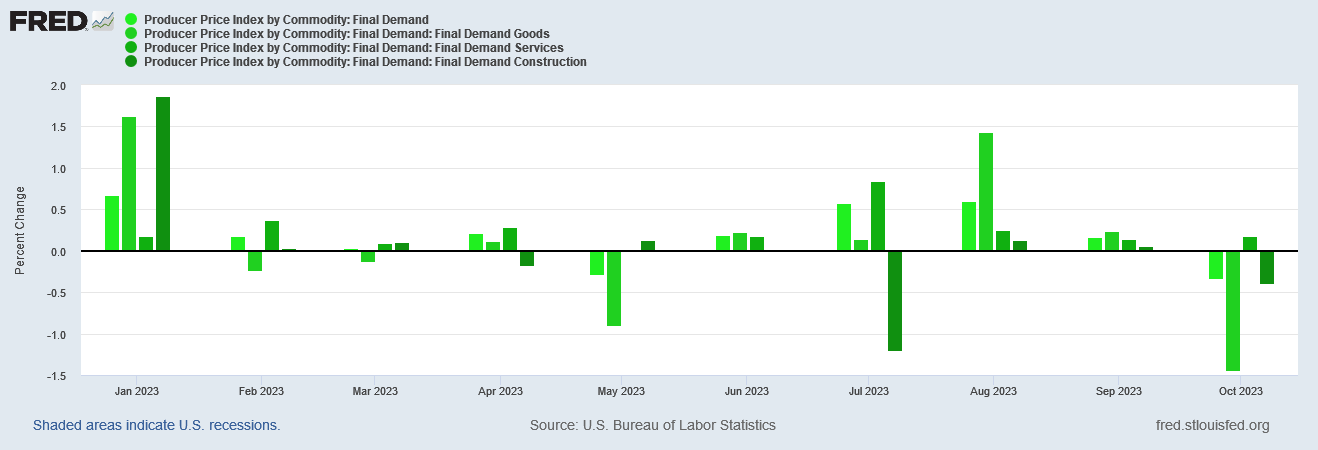
Yet there is bad news in the PPI summary. Prices across the major categories not only largely declined in October, with only Final Demand for Services posting any increase, but price growth itself has been problematic going back into summer 2022.
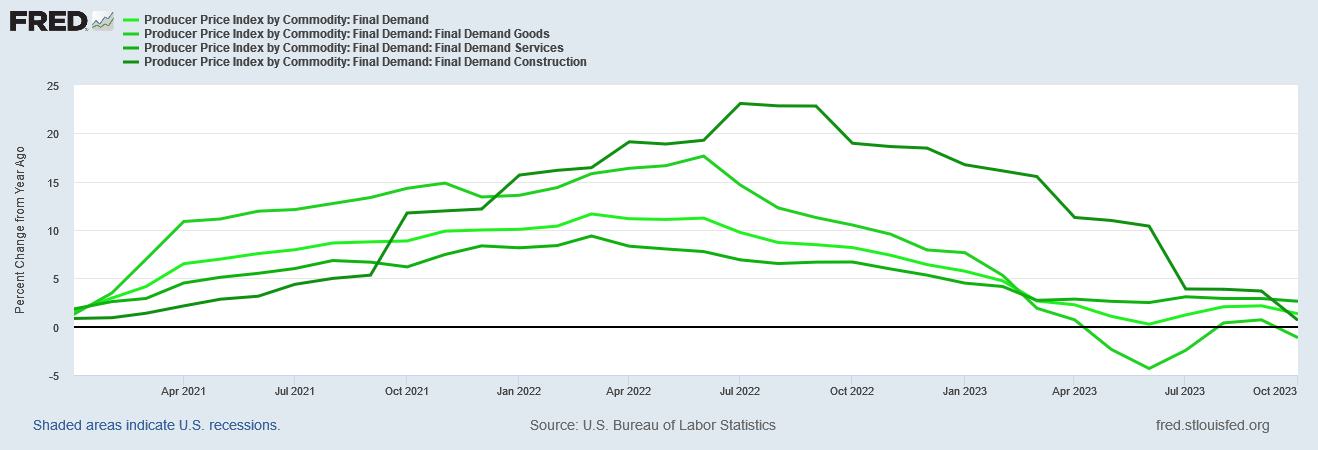
Final Demand for Construction plateaued at the beginning of 2023 before moving marginally lower. Final Demand for Goods has been in outright deflation since June of 2022.
When we look at the year on year percentage changes in the PPI components, we see that the post-pandemic rise of factory gate inflation has almost completely resolved itself.
The headline inflation rate, printing at 1.33% year on year for October, is lower than the January 2021 year on year rate of 1.59%. Final Demand for Goods, having slipped back into deflation, is significantly lower than in January 2021. Final Demand for Construction came in at 0.65% year on year, versus 0.85% year on year in January 2021. Final Demand for Services is higher by 0.8 of a percent—2.62% year on year versus 1.83% in January 2021.
If the PPI is any guide, the corporate media has gotten this much right: the PPI data is telling us factory gate prices have fully digested the inflationary pressures which have arisen since Dementia Joe began his Reign of Error in 2021.
However, the PPI data is saying rather more than just that.
The October decline was not merely a drop in producer prices. It was an outright plunge month on month for all but the Final Demand for Services component.
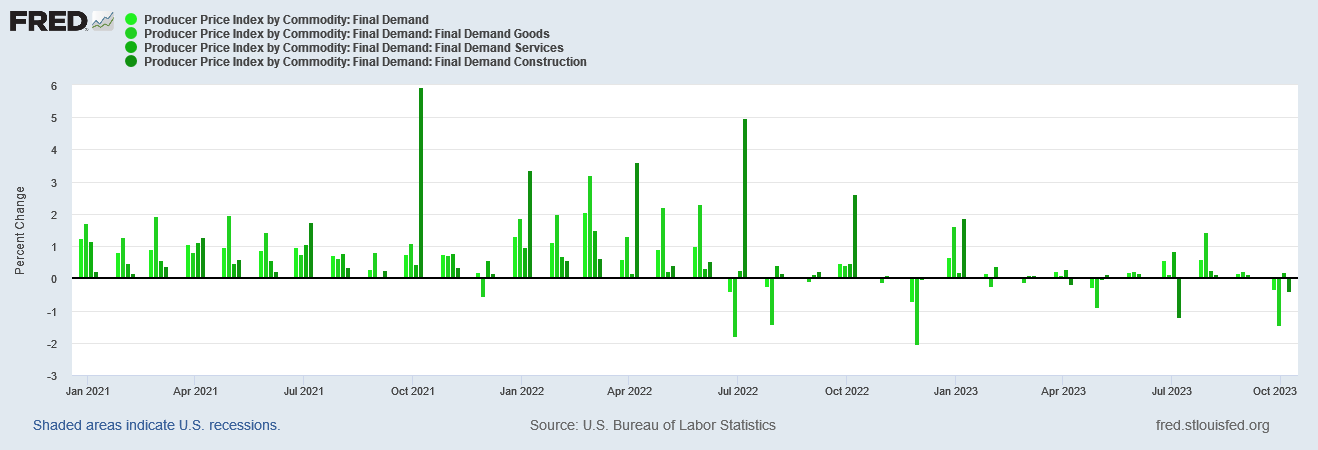
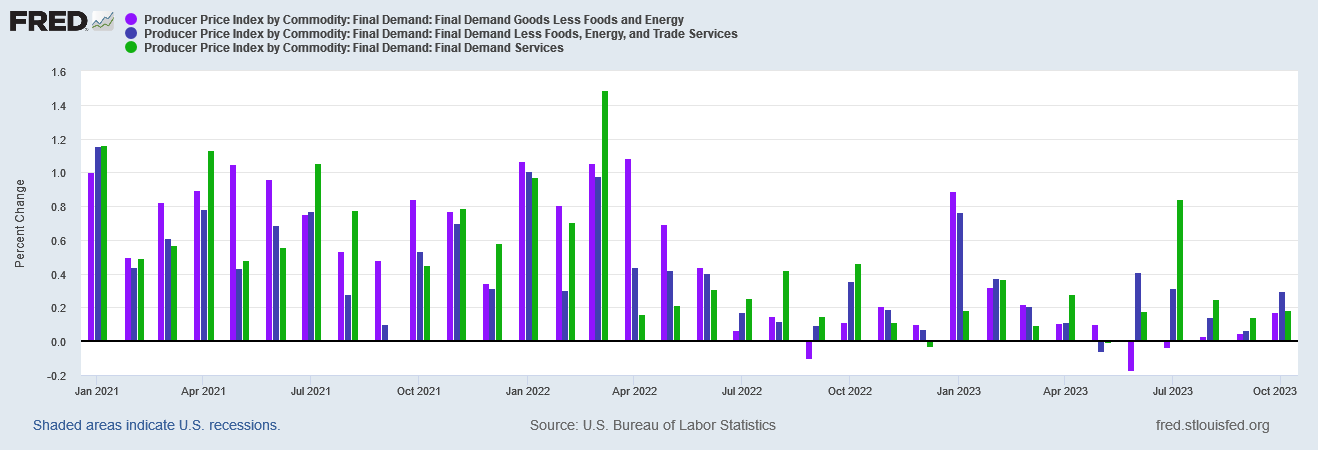
Moreover, if we look at the month on month percentage changes since January 2021, we see that factory gate inflation significantly abated after June 2022, and has been getting steadily softer since that time.
Referring back to the year on year percent chart above, we see that the month on month inflection point largely matches the year on year inflection point. This is further confirmation that inflation—both producer price inflation and consumer price inflation—peaked last summer and has been easing ever since. So much “easing” has taken place that the disinflation which has taken place since summer 2022 is now turning into deflation.
The source of much of the price decreases is our old friend energy prices. Even the Bureau of Labor Statistics concedes that much of the drop in factory gate prices comes from a decline in energy prices.
Over 80 percent of the October decline in the index for final demand goods is attributable to a 15.3-percent drop in prices for gasoline. The indexes for diesel fuel; hay, hayseeds, and oilseeds; home heating oil; liquefied petroleum gas; and light motor trucks also fell
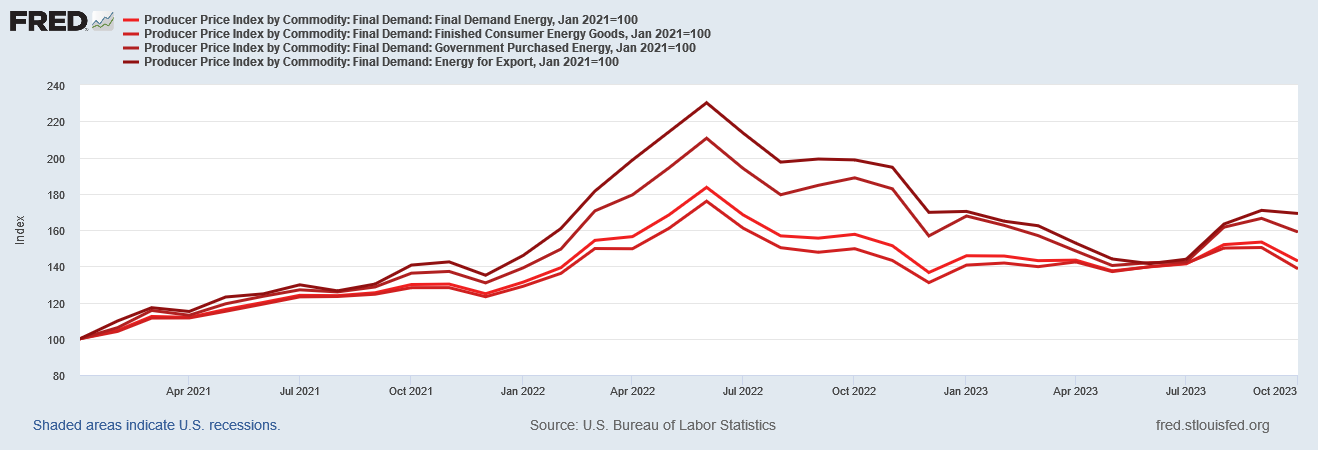
When we look at the Final Demand for Energy and its various subindices since Januar of 2021, we see an old familiar shape to the chart.
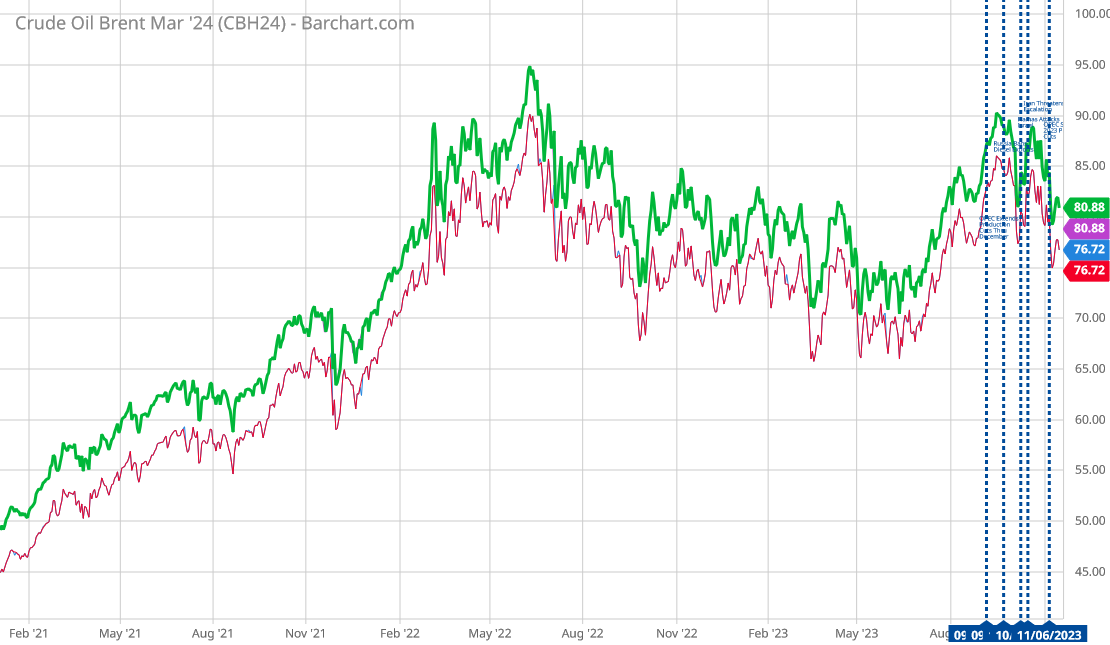
If we look at the rise and fall of crude oil prices, just as with the Consumer Price Index Summary, we see the same peaks at the same time frame (June 2022).
There is little doubt about why energy prices have been coming down. The inability of oil markets to sustain prices has been transmitted throughout not just the US economy but the global economy in the form of lower energy prices across the board.
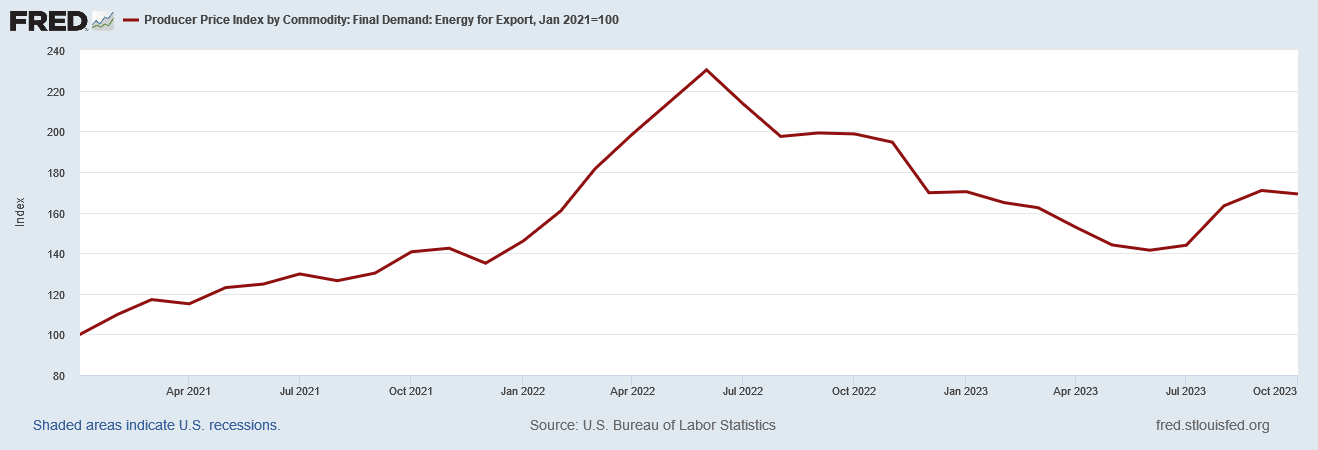
To see why we can know this we should give particular attention to the Final Demand category Energy for Export.
While this component charts in much the same way as crude oil prices, with peaks and troughs lining up rather well, it is important to note that this is focused on the oil and refined products the United States sells to other countries—which is to say it is not oil and refined products consumed by Americans. As the US is a major energy exporter, the PPI for Final Demand: Energy for Export is an additional metric giving us the state of global energy demand, and at the moment, global energy demand is waning.
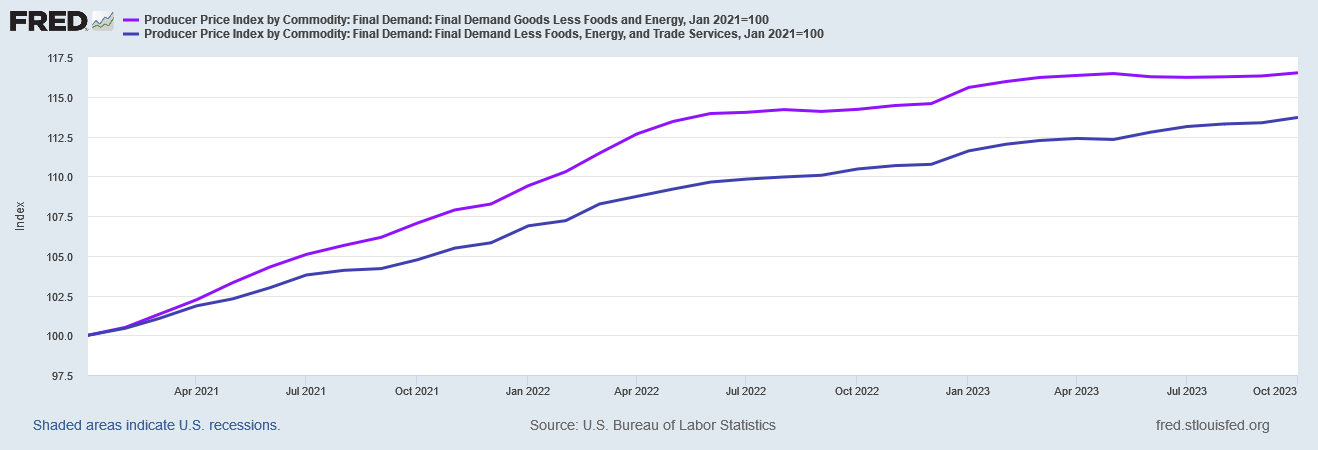
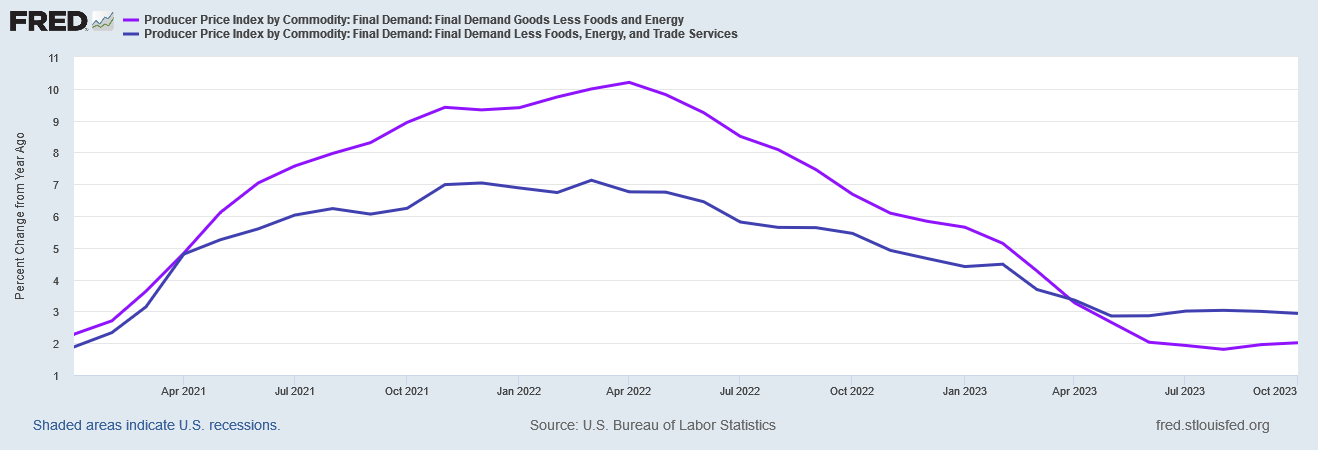
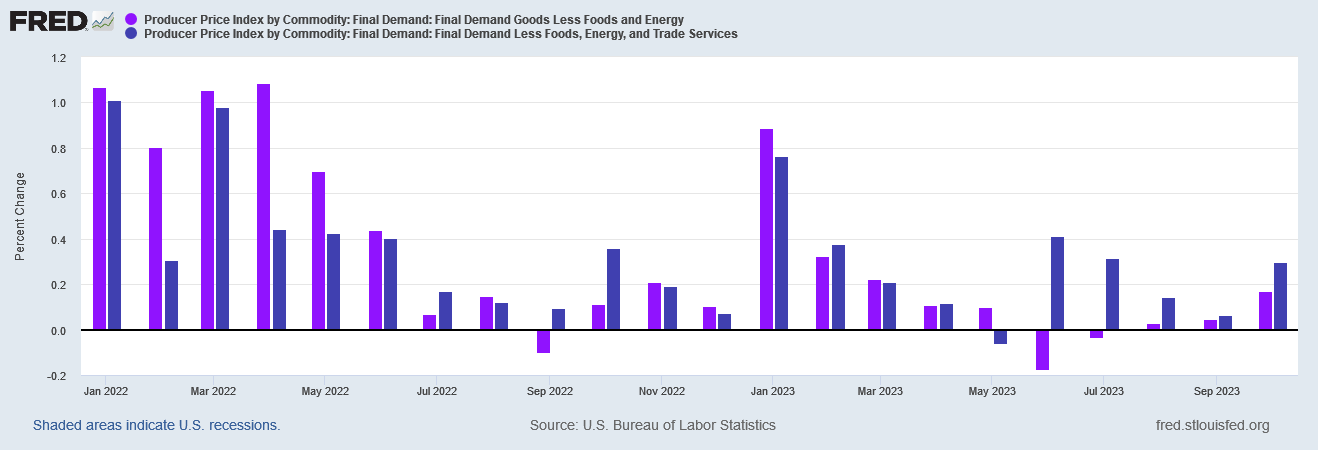
While deflation is a major story within the Producer Price Index Summary, it is also important to recognize that it is not the only story. Prices are not dropping across the board, and within the “core” PPI components—e.g., Final Demand Goods Less Food and Energy, and Final Demand Less Food, Energy, and Trade Services—we are still seeing price inflation.
While these PPI components have charted rising and falling producer price inflation much like the rest of the PPI, in recent months the disinflationary trend has ebbed for the “core” components.
Not only has it ebbed year on year, but looking at the data month on month we see that disflationary trend reversing over the past couple of months.
With inflation never having really left the Final Demand for Services component, we see at least a mild inflationary impulse across these three components of the PPI particularly in recent months.
Even though the broader PPI is signalling deflation, even within that deflationary signal there is still some sign of producer price inflation, leaving us with a degree of stagflation much like what the PPI signaled last month.
With factory gate prices for goods either stagnant or in decline, and with factory gate inflation for services seemingly intractable, what the PPI is showing when all the data is examined is not rising inflation across the board but a continuation of the stagflationary trends we have been seeing for some time.
Whether there is deflation or stagflation, however, the end result for the economy is still the same: recession. These are not indicators that associate with economic growth. At a minimum they portend economic weakness, and at a maximum they portend economic contraction.
As the component labels suggest, producer prices reflect demand for various goods and services. A declining PPI reflects falling demand for those goods and services. The PPI for goods has been falling since summer 2022, and the PPI for construction began trending down this past June.
Declining prices can easily be seen as a good thing particularly after a period of extreme inflation. Declining demand, on the other hand, by definition means a slowing and shrinking economy. Declining demand is exactly what the PPI has been showing us, which means the October drop in the PPI suggests an unusually large drop in demand is taking place, and that is not at all a good thing.
This is amplified by a similar set of recessionary signals emanating from the October Consumer Price Index Summary focused on consumer price inflation.
Unfortunately, there are multiple and accumulating signs of economic weakness from literally every direction, which means October’s inflation data is ultimately a slice of dangerous economic news and potentially very bad economic news. It is cause not for celebration but for consternation.
Recession is upon us, and is getting worse, not better.
The Producer Price Index is leaving us in the same position as the Consumer Price Index, with multiple and accumulating signs of economic weakness from literally every direction.
Recession is upon us, and is getting worse, not better.


My husband txt me this morning he got gas for $1.63. I told him make sure you thank BiDeN for working hard during the holidays 🥴😆
"Recession is upon us, and is getting worse, not better."
Bidenomics at work.