The night before the Bureau of Labor Statistics posted their November Consumer Price Index Summary report, I commented on how corporate media was finally starting to recognize the stagflationary trends that have bedeviled the US economy for over a year.
The reality of stagflation is not here because I say it is here, or because Wall Street says it is here, but because the data says it is here. Based on the available nowcast data, the reality of stagflation is going to continue to be here for at least another month, and the “experts” are just now coming to realize that.
When the CPI report did come out, it confirmed what Seeking Alpha postulated on Monday and what I have been saying for over a year: stagflation is here and is dragging the US economy down.
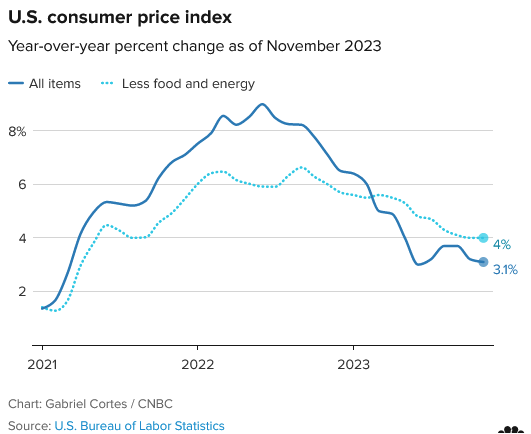
The Consumer Price Index for All Urban Consumers (CPI-U) increased 0.1 percent in November on a seasonally adjusted basis, after being unchanged in October, the U.S. Bureau of Labor Statistics reported today. Over the last 12 months, the all items index increased 3.1 percent before seasonal adjustment.
The index for shelter continued to rise in November, offsetting a decline in the gasoline index. The energy index fell 2.3 percent over the month as a 6.0-percent decline in the gasoline index more than offset increases in other energy component indexes. The food index increased 0.2 percent in November, after rising 0.3 percent in October. The index for food at home increased 0.1 percent over the month and the index for food away from home rose 0.4 percent.
Some prices rose, some prices fell. Some prices fell after rising, and some prices rose after falling. As has been happening for months, relative prices are continuing to distort and continuing to sap productive impetus out of the economy.
My comment from yesterday when the report came out still stands: Stagflation can no longer be denied.
Corporate media and Wall Street are still slow to fully admit what is now indisputable, but the data leaves little room for doubt anymore. Stagflation is real, and is really happening.
Corporate media, true to form, was studiously blase about the numbers.
The November numbers are still well above the Fed’s 2% target, though showing continuing progress. Policymakers focus more on core inflation as a signal for longer-term trends.
The report was “somewhat in line, although, I suppose not as good as what some might have hoped that we would start to see more deceleration on a month over month basis,” said Liz Ann Sonders, chief investment strategist at Charles Schwab. The Fed “will probably talk about continued disinflation being good news.”
Fundamentally, as long as inflation is broadly in a downward trend from its hyperinflationary peak in the summer of 2022, corporate media and their economic “experts” will continue to interpret the data as being all positive.
“Inflation is still on the high side of what I think everyone would feel comfortable with, but it’s coming back down to earth steadily but surely,” said Mark Zandi, chief economist at Moody’s Analytics.
U.S. consumer price index
Year-over-year percent change as of November 2023
The line chart shows the year-over-year change in the consumer price index for all items and all items less food and energy from January 2020 through November 2023.
The U.S. Federal Reserve aims for a 2% annual inflation rate over the long term.
“I expect by this time next year we’ll be back within spitting distance of the target,” Zandi said.
Since inflation is coming down, the Fed’s 2% inflation target is sure to be reached—according to the consensus of the “experts”.
Most economists expect the rate of price increases to keep slowing in the coming months. Though the decline could follow a bumpy path, inflation should fall much closer to the Fed’s 2% target by the end of 2024. Wages and rental prices, among other items, are now increasing more gradually.
Wall Street was tentatively optimistic on the inflation report, with the major stock indices moving slightly upward after an initial dip at the opening bell.
Treasury Yields also edged up slightly on the day—there was at least enough reality on Wall Street to recognize that inflation had not made much headway in November.
If Wall Street realizes the US is spiraling into stagflation, it is hiding that realization very well.
Yet the data leaves very little doubt that stagflation is what we are seeing.
Not only is core inflation year on year showing signs of flattening out, but headline inflation is still higher than it was in June.
Month on month, inflation rose for the second month in a row for both headline and core inflation.
On its own, this slowing and reversing of disinflation is a worrisome trend. However, that is not the only trend that must give us pause.
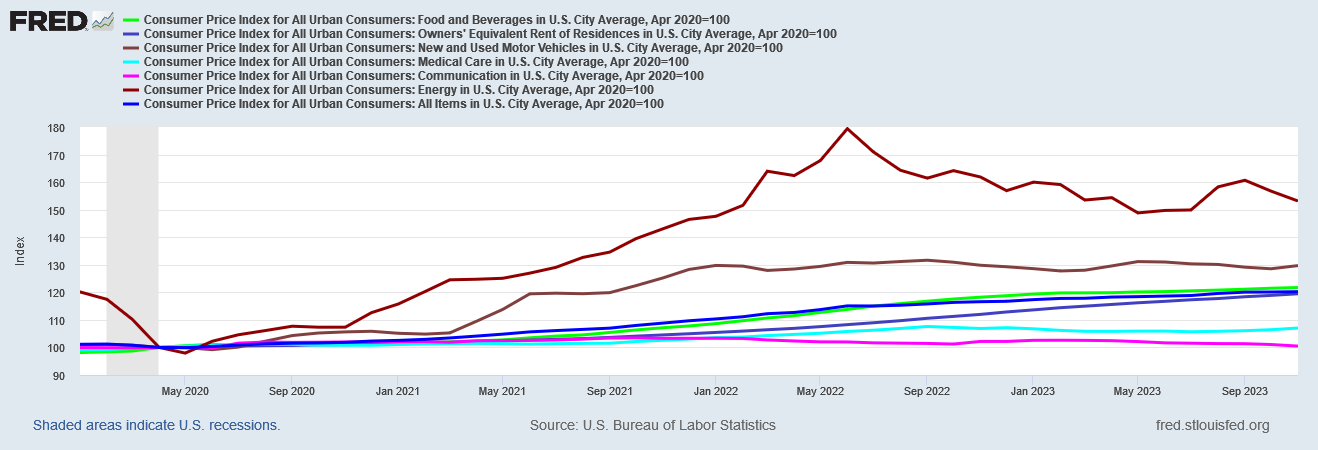
We can see the extent to which inflation has shifted relative prices across the totality of consumer prices, and the distortions are significant.
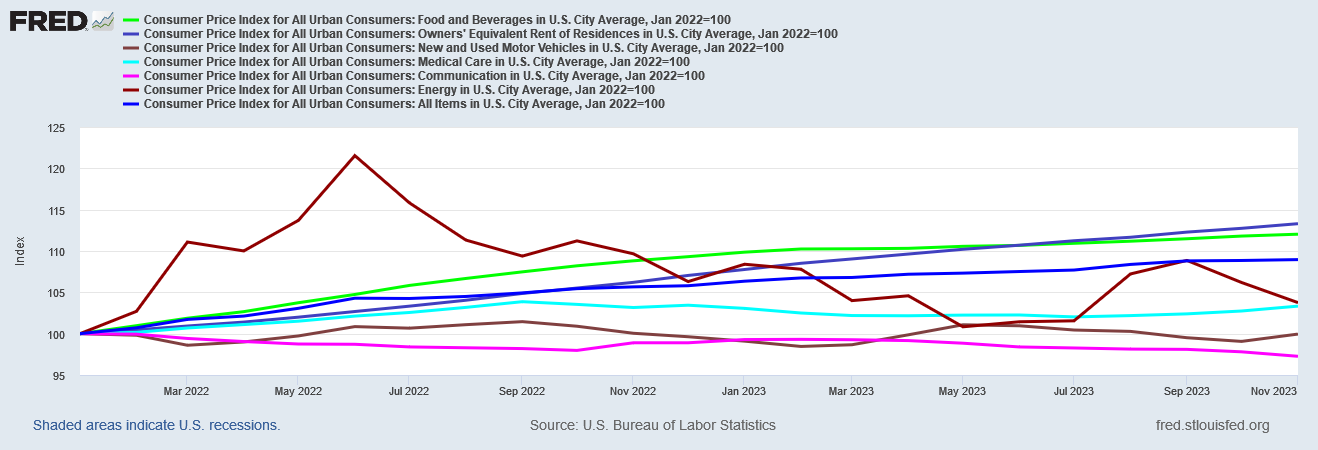
Energy price inflation has seen by far the greatest increases since the Pandemic Panic Recession. Yet energy prices have also seen some of the greatest decreases as well. If we re-index the consumer price indices to January of 2022, we see a significantly different price structure emerging.
Not only did energy prices almost completely reverse their increases from the start of 2022 by May of this year, but by last month, energy prices were up only 3.8% from January, 2020. New and Used Cars, after slipping into outright deflation over the summer, printed at the same overall price level in November as they had in January of 2022. Meanwhile, the food price and Owner’s Equivalent Rent of Residence indices rose more than headline consumer price index over 2022-2023..
In the eleven months of 2023 in the history books so far, several price indices are printing outright deflation for November, and only the Owner’s Equivalent Rent of Residence index has risen more than the headline consumer price index for 2023.
Whenever we start to see these combinations of inflation and deflation happening side by side, that is a sign that we are facing stagflation.
We should understand that are more signs of stagflation than just diverging price indices.
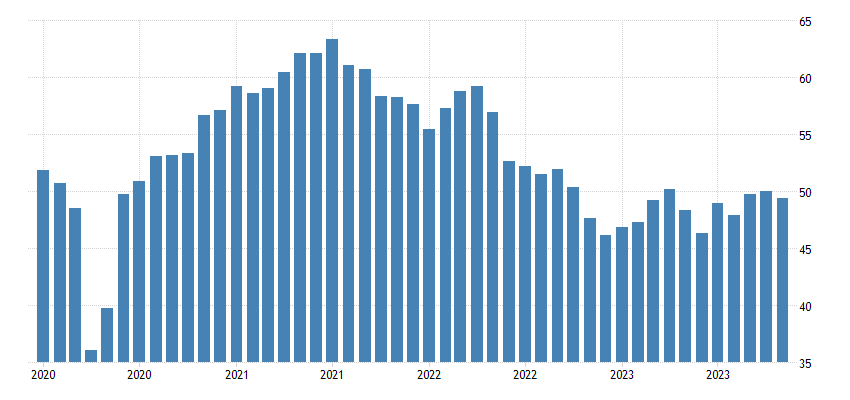
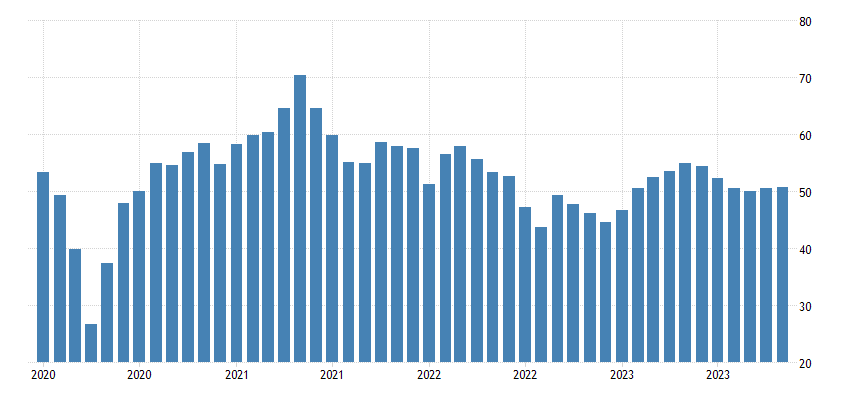
The ISM Purchasing Managers’ Index for Manufacturing has been showing contraction (PMI < 50) since October, 2022.
The S&P Global PMI for Manufacturing has likewise been printing contraction for over a year.
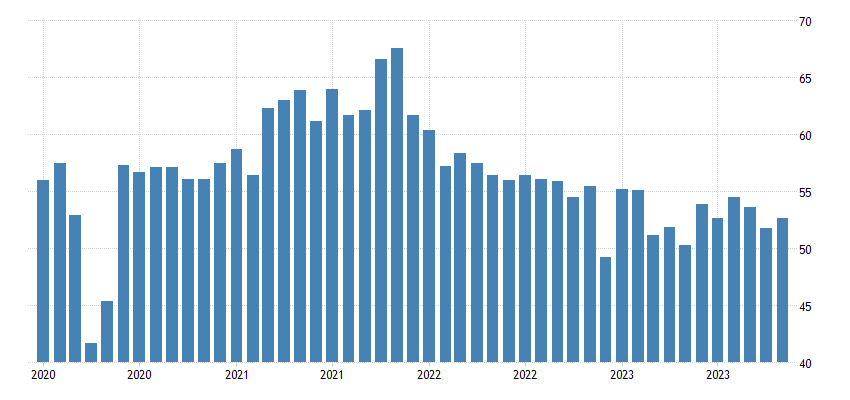
While the ISM Services PMI has looked a little better than the ISM Manufacturing PMI, it nevertheless shows the services side of the economy has itself softened significantly since mid-2021.
The S&P Global Services PMI is likewise showing the services side of the economy slowing and getting softer.
Inflation is not being overcome even as the economy is getting slower and softer. This is the essence of stagflation.
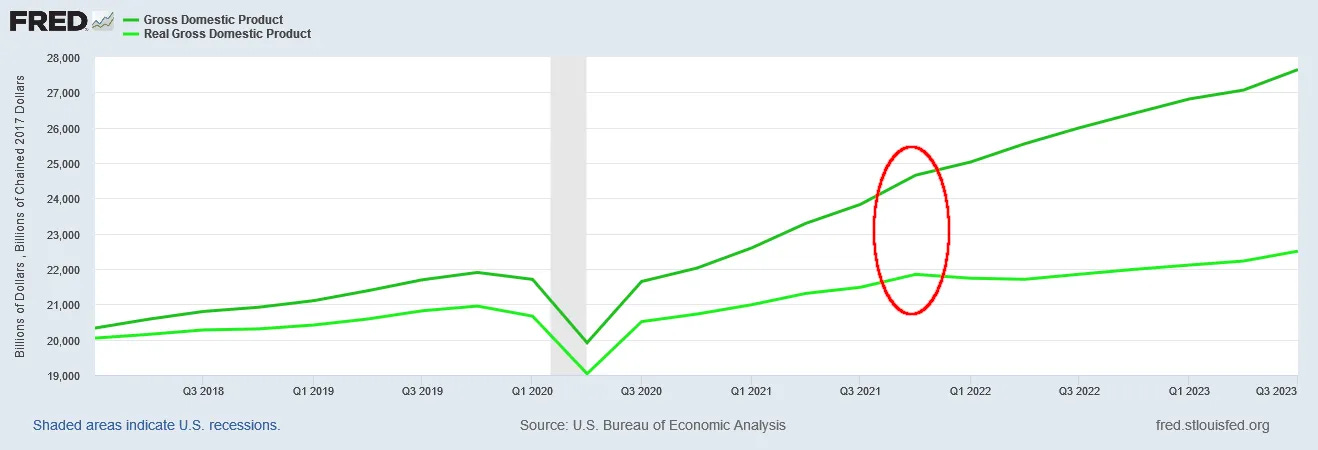
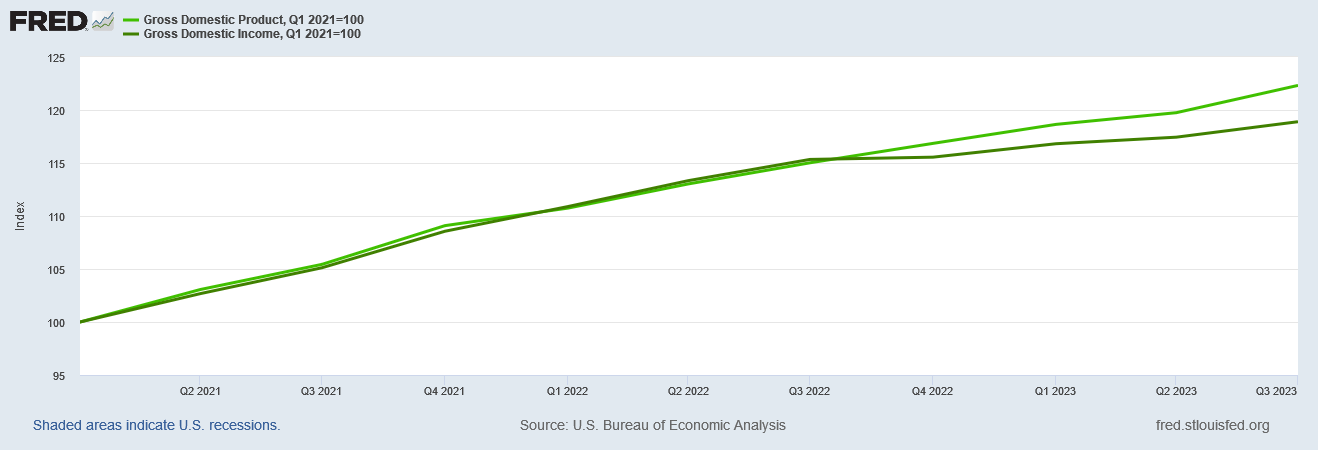
As I have pointed out previously, even the GDP data shows a significant downshift in the growth rate starting in the fourth quarter of 2021.
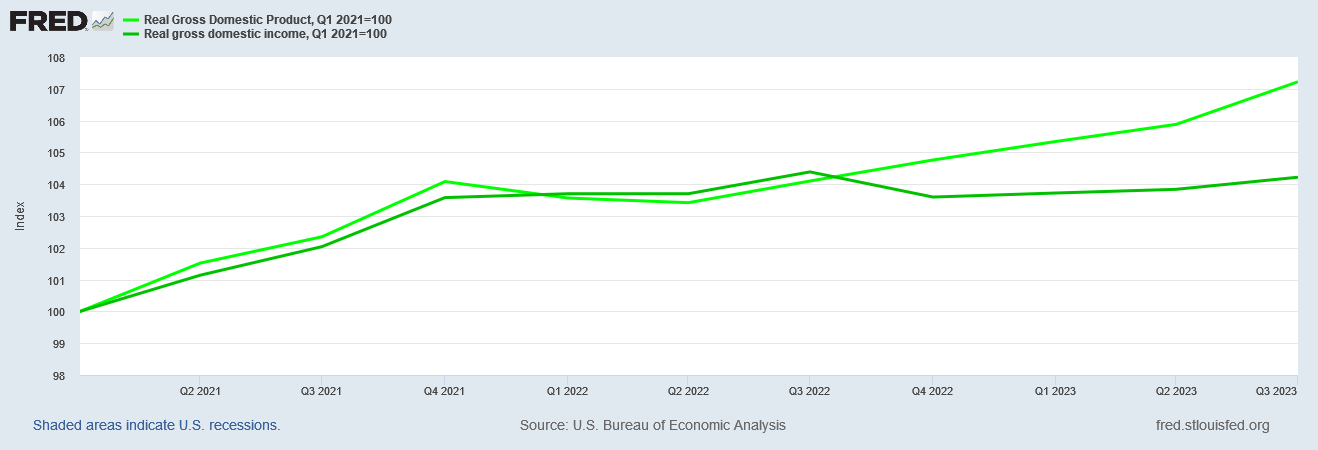
The downshift in Real Gross Domestic Income in the third quarter of 2022 is another indicator of a softening and shrinking economy.
That even nominal GDI and nominal GDP diverged after Q3 2022 is yet another recessionary indicator.
With the data flashing “recession!” even as the consumer price index data showing inflation remaining stubbornly above the Fed’s target of 2% year on year, stagflation is the only conclusion to be drawn. Normally, a shrinking economy is matched by falling prices. Instead, our present circumstance is too-high inflation alongside a shrinking economy—the epitome of the stagflationary scenario.
While Seeking Alpha was willing on Monday to at least contemplate the possibility that the inflation data would show stagflation for the US economy, the reporting that has come after the BLS published the CPI data shows that awareness is very much the outlier in the corporate media.
Financial market performance subsequent to the publication of the CPI report shows that awareness is still nonexistent on Wall Street.
Yet despite the unwillingness of the corporate media and Wall Street to acknowledge this reality, the data just does not leave any room for any alternative interpretation. Not with month on month inflation rising at both the headline and core levels, even as year on year inflation remains stubbornly well above the Fed’s 2% year on year inflation objective.
The month on month inflation having risen for the second month in a row makes any prognostication that the Fed’s 2% year on year inflation goal will be reached in early 2024 simply absurdist wishful thinking. The data also makes plain that, without energy price deflation having been predominant in 2023 to date, inflation would be significantly higher. Given the influence of energy prices on other price categories, energy price deflation is undoubtedly as influential in the easing of both headline and core inflation as energy price inflation was in the acceleration of both in 2021 and 2022.
There is no subtle analytical technique at play here. One need only look at the increases along several price indices and place that in the context of the numerous recessionary red flags flashing across the entire economy to conclude that we are right now experiencing stagflation.
Corporate media might prefer to ignore what is now unavoidably and indisputably obvious. Wall Street might prefer the corporate media narrative to reality. I do not recommend being persuaded either by the corporate media narrative on the economy or Wall Street’s slavish devotion to it.
As I predicted before the CPI report came out, the moral of this story is clear: do not listen to the “experts”. Follow the data instead—the data is always more reliable than the “expert” analysis. The CPI data is proving that truism in abundance.







Current narrative is that, since the Fed cannot hike forever, that ZIRP is inevitable so let's front-run it.
Powell can reassert the strong pimp hand today for a mere +25 bps.