Personal Income No Match For Energy Prices
Inflation Creeps Up Again. Stagflation Continues.
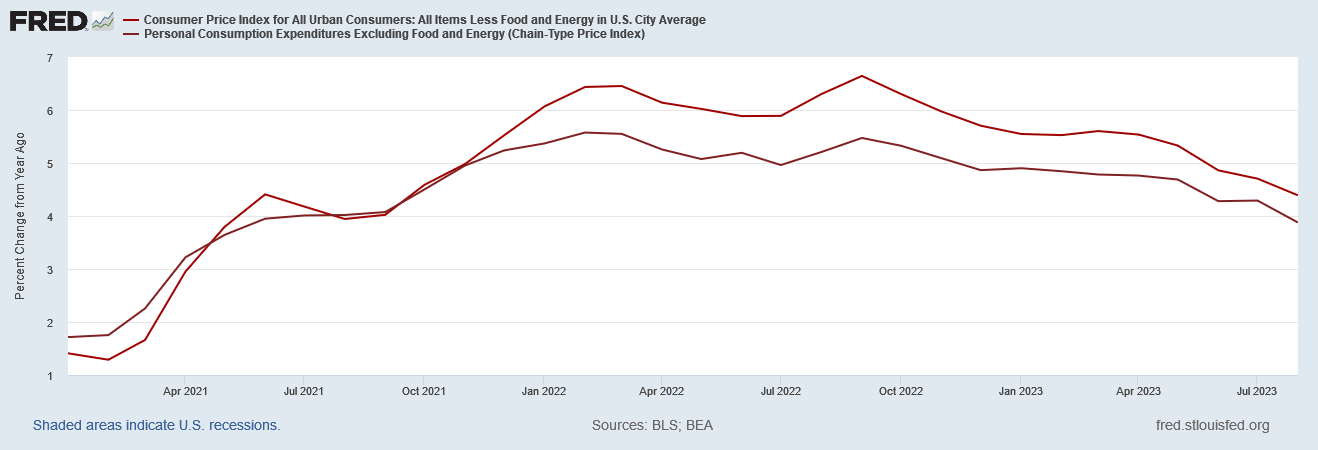
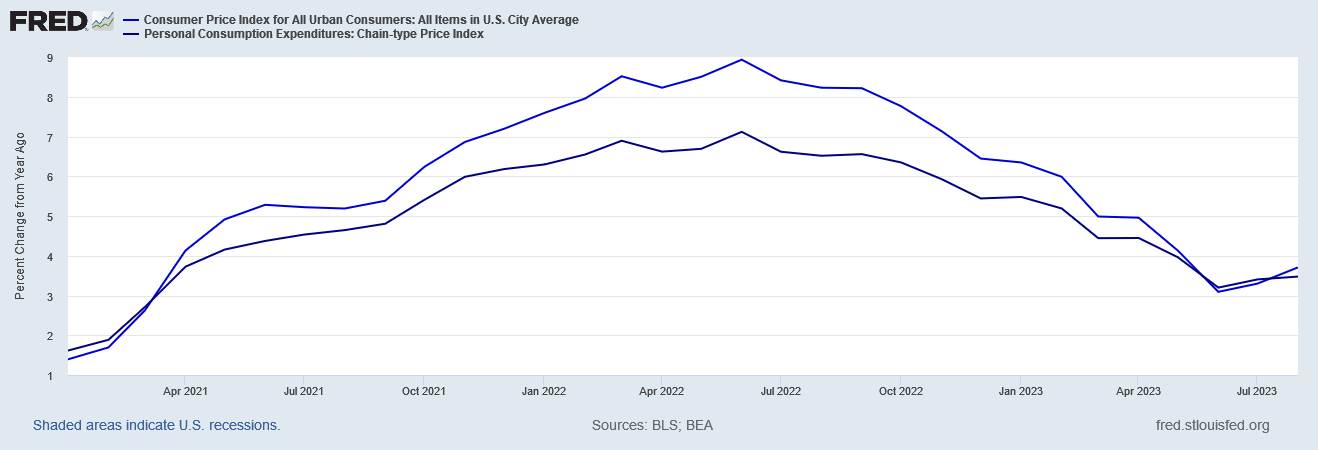
To hear corporate media tell the story, the BEA’s August Personal Income and Outlays report contains mostly good news. It contains good news because “core” inflation is down even though headline consumer price inflation rose yet again.
Personal income increased $87.6 billion (0.4 percent at a monthly rate) in August, according to estimates released today by the Bureau of Economic Analysis (table 2 and table 3). Disposable personal income (DPI), personal income less personal current taxes, increased $46.6 billion (0.2 percent) and personal consumption expenditures (PCE) increased $83.6 billion (0.4 percent).
The PCE price index increased 0.4 percent. Excluding food and energy, the PCE price index increased 0.1 percent (table 5). Real DPI decreased 0.2 percent in August and real PCE increased 0.1 percent; goods decreased 0.2 percent and services increased 0.2 percent (tables 3 and 4).
According to the corporate media, these are positive signs that inflation is getting better.
"It's about as good as you could expect," Moody's analytics chief economist Mark Zandi told Yahoo Finance Live. "0.1%, that's a really marvelous number. I'm sure it's overstating the case, I don't think it pushes all the way back into the Fed's target [2%] quite yet, but all the trend lines there look good."
How much “better” inflation is actually getting is problematic. As the Wall Street Journal at least managed to acknowledge, energy prices jumped and inflation followed along for the ride.
Higher gasoline prices boosted August consumer spending and kept inflation elevated, while underlying price pressures cooled amid the Federal Reserve’s efforts to slow the economy.
What gets missed is that energy prices are once again distorting and disrupting relative prices which forces shifts in consumption. Energy price inflation is still inflation, and still a problem for the average consumer.
What the corporate media chooses to largely overlook is that the BEA’s report shows Real Disposable Income actually decreasing for the second month in a row.
Inflation increasing while income is decreasing is not the typical consumer’s idea of an improving economic situation. Most consumers want more income and less inflation (imagine that!).
What has economist Mark Zandi rather fatuously gushing is the decline in “core” inflation—consumer price inflation with the more volatile food and energy components stripped out.
Presumably, core inflation is more important than headline inflation, which has been rising for the past couple of months.
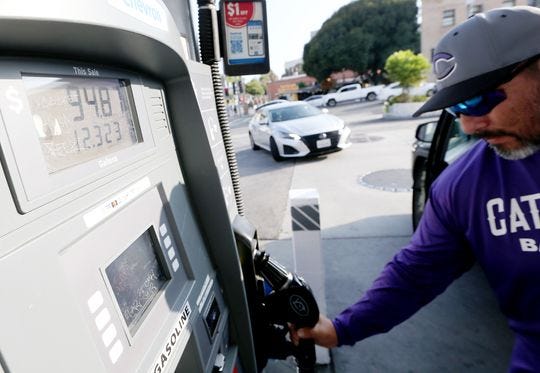
Whether the average consumer standing at the gas pump watching more of his shrinking take-home pay disappear into his gas tank agrees with Mark Zandi I leave for the reader to surmise.
Make no mistake, take-home pay is shrinking, particularly when factoring in inflation.
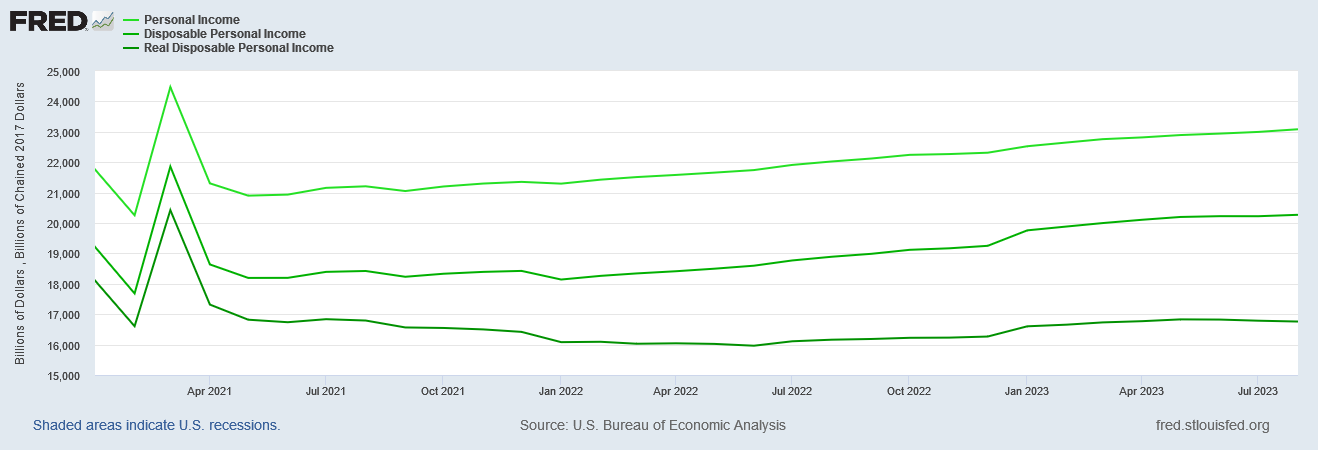
Viewed on its own, personal income appears to be increasing.
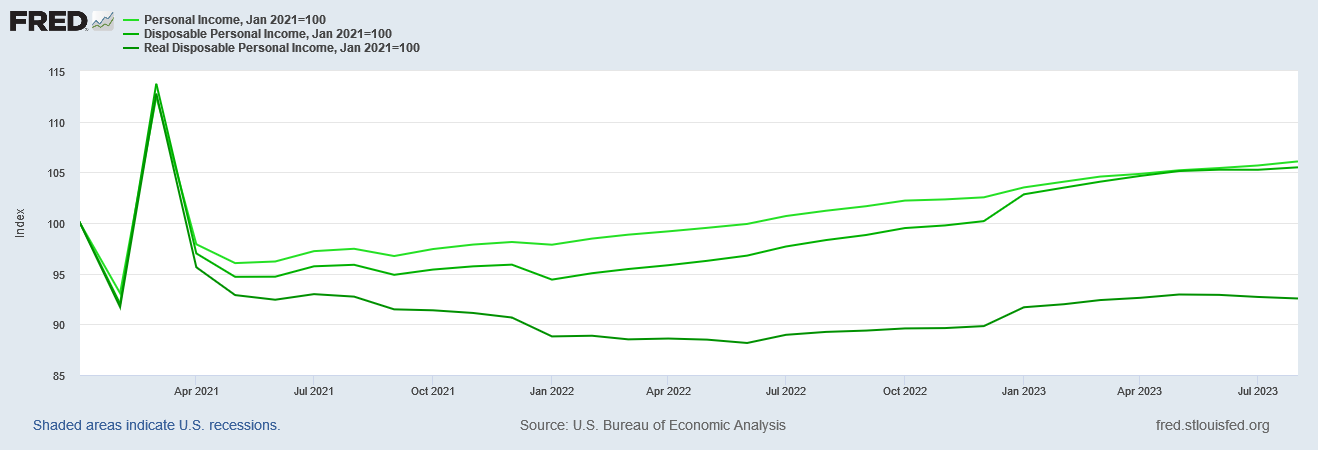
However, as one can tell by looking at where the graphs start and where they end, disposable incomes in particular have had bit of a wild ride over the past couple of years. If we look at the percent change year on year, we quickly see that even nominal personal incomes went through a period of decline in 2022.
If we index the income data to January, 2021, we get a much clearer view of the magnitude shifts over time, and we begin to see what has actually happened to disposable income (take-home pay) since then.
Nominal personal incomes decline sharply early in 2021, and did not recover to January 2021 levels until July 2022. Nominal disposable personal incomes did not recover until December 2022. Real disposable personal incomes have yet to recover—and have been in further decline through July and August.
These are trend lines that “look good”?
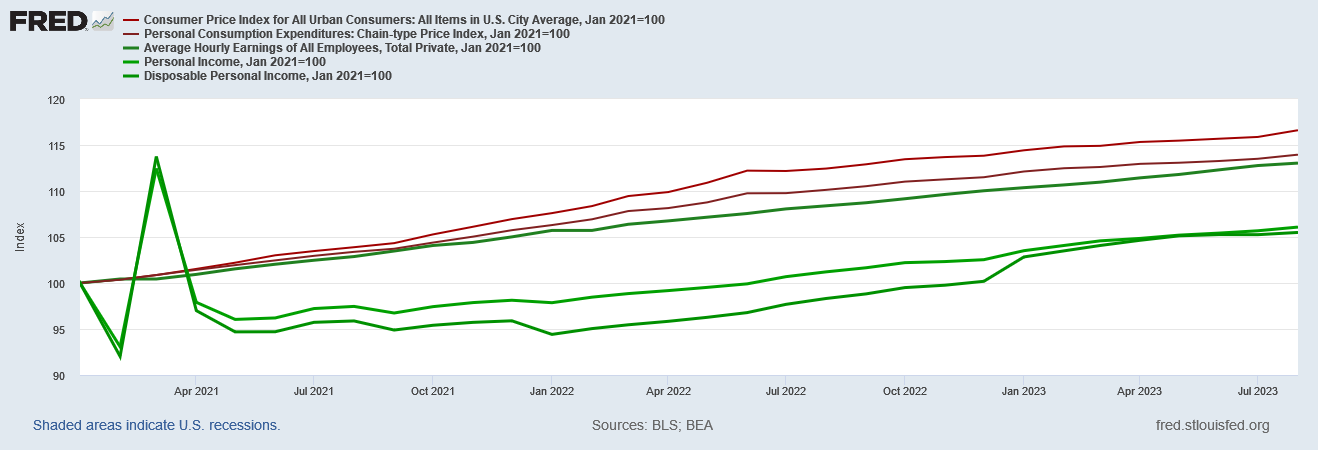
Even more disconcerting than the obvious decline in real disposable incomes is the failure of nominal incomes to keep pace with inflation for most of the past few years. Throughout most of 2022, consumer price inflation as measured by both the CPI and the PCEPI indices exceeded the percent change year on year in nominal income and nominal disposable income.
Index inflation and income data to January 2021 and we can see just how badly incomes have failed to keep pace with inflation.
While on a month on month basis, personal incomes have recently grown faster than inflation, that has not been enough to overcome the deficits that arose in early 2022. That progress incomes were making over rising consumer prices came to an end in August.
Nor is there any mystery as to why personal income growth slipped below inflation again: energy prices.
Energy price inflation has been the inflation story since the beginning of this inflationary cycle, with food price inflation serving as a crucial subtext.
While the Fed prefers to focus on “core” inflation because of “volatility”, the reality is that energy prices—and food prices to a lesser extent—tend to be quite impactful on overall price levels, both in the increase and in the decrease.
While core inflation has still risen sharply in the wake of the Pandemic Panic Recession, it was energy prices that has given this inflationary cycle its hyperinflationary feel, and it has been energy prices that have accounted for most of the decrease in headline inflation since its June 2022 peak.
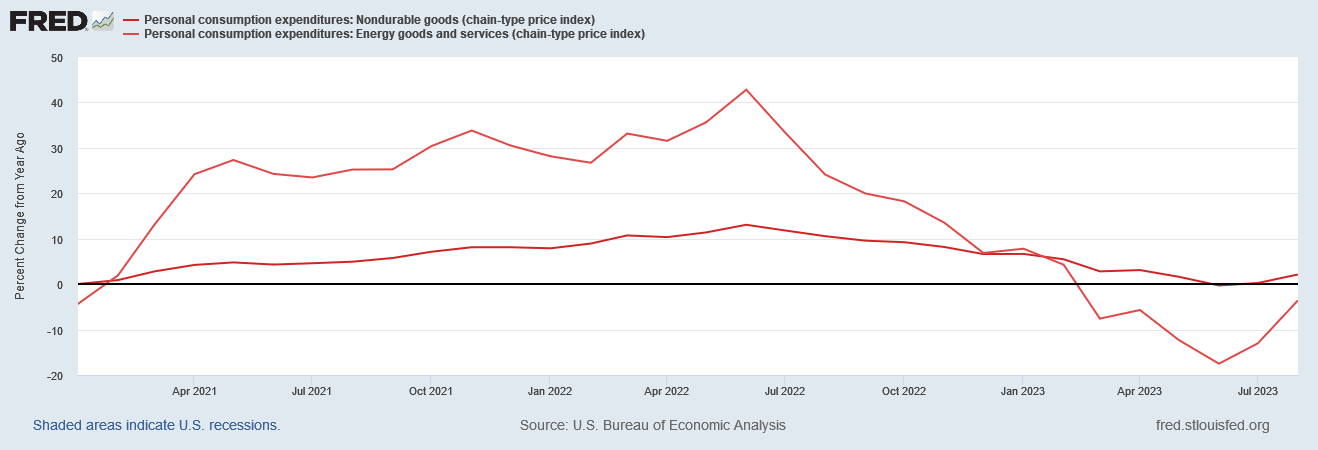
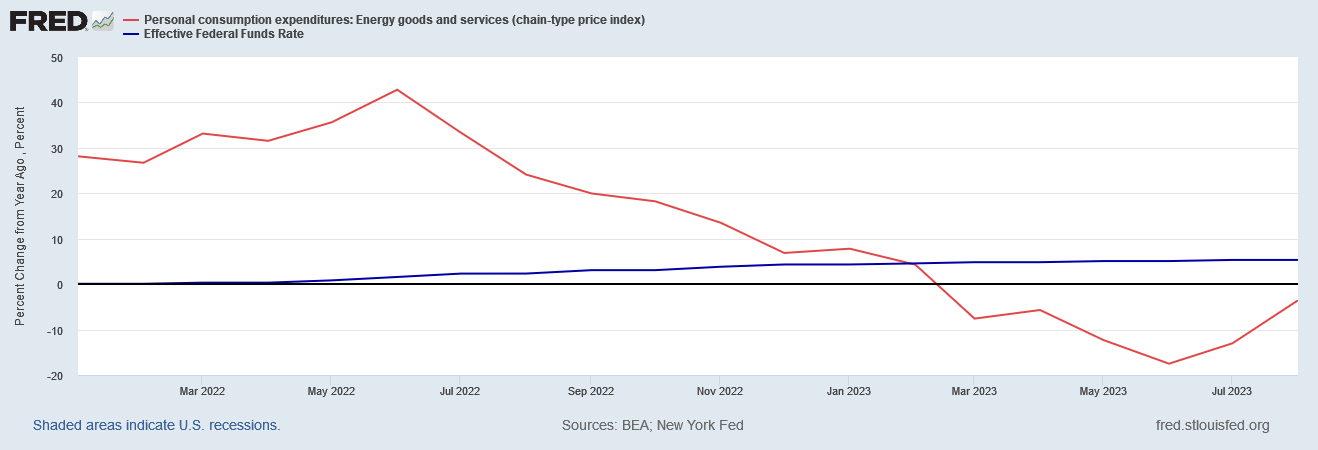
Moreover, energy prices are a likely suspect behind the shifts in price indices for both goods and services since the recession. If we look at the indices for non-durable goods and energy goods and services, we see that the percent change year on year charts follow similar trajectories, with the energy chart differing only in the magnitude of the changes.
If we put the charts on separate axes, we see that the rises and falls of both are almost perfectly in sync.
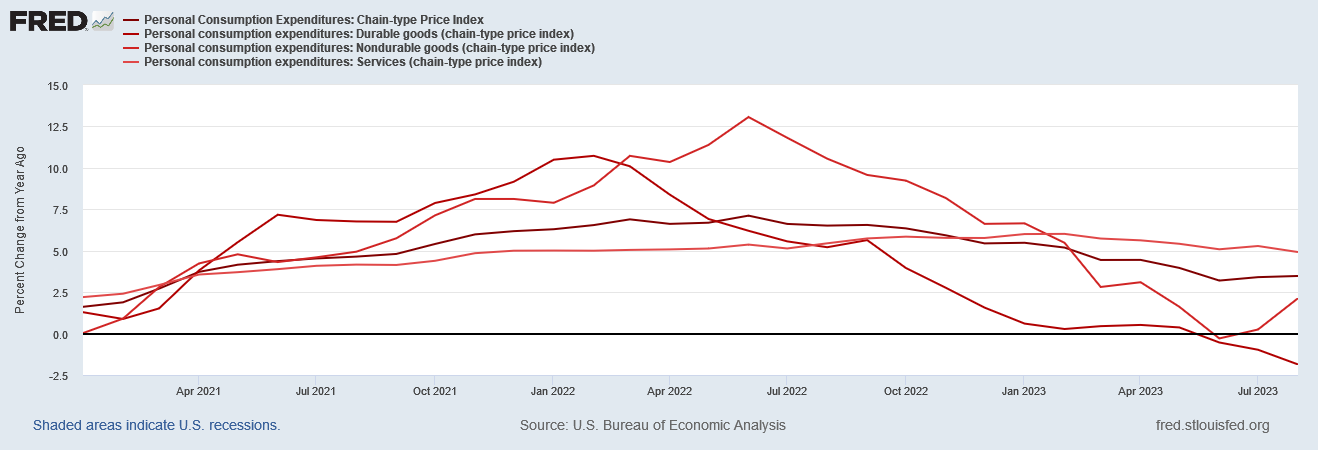
Thus energy becomes the backdrop for consumer price inflation among durable goods, non-durable goods, and services.
While durable goods have been in a disinflationary/deflationary trend since early 2022, energy prices have been pushing up non-durable goods and service prices, causing inflation to show up there and not elsewhere.
This outsized impact of energy prices on consumer price inflation is bad news for the Federal Reserve and for Jay Powell’s inflation-fighting strategy. Energy prices are, for the most part, immune to interest rate hikes.
As energy prices have been the engine powering inflation, when energy price inflation peaked in June 2022, and when energy prices slipped into outright deflation earlier this year, those decreases pulled the headline inflation rate down as well.
With energy prices on the rise again, they are demonstrating just how impotent the Federal Reserve has been on inflation, and how useless their interest rate hikes have been in fighting inflation.
As the durable goods data shows, outside of energy there is a strong deflationary component within consumer prices, and has been for quite some time.
With durable goods in deflation and energy showing inflation, once again we are confronted with the reality that the US economy is mired in stagflation and has been for quite some time. We are likely to be mired in stagflation for some time yet to come.
What the BEA data for August shows is exactly that. We are not looking at “cooling” inflation. We are looking at rising energy price inflation and durable goods price deflation, with other goods and services being dragged along for the ride. We are looking potentially at a rolling recession. We are looking at the distortions that energy price inflation inflicts on an economy.
We are looking at stagflation. Again.










A friend’s brother is a truck driver and just stopped being an owner operator to work for a company because losing so much on loads due to cost of diesel. I have a small freezer and am contemplating filling now if groceries are going to continue to rise, it was helpful in 2022.
Argh!
I did, for the first time in months, pay less than $4 a gallon for premium, which I still use in the little Audi 1.4 liter turbo engine. I usually keep it above 40mpg, usually, thanks to the hybrid drive system. Really short trips I do not use gas at all.