Producer Prices: What Lies Ahead
Enjoy The Disinflation While It Lasts. Because It Won't.
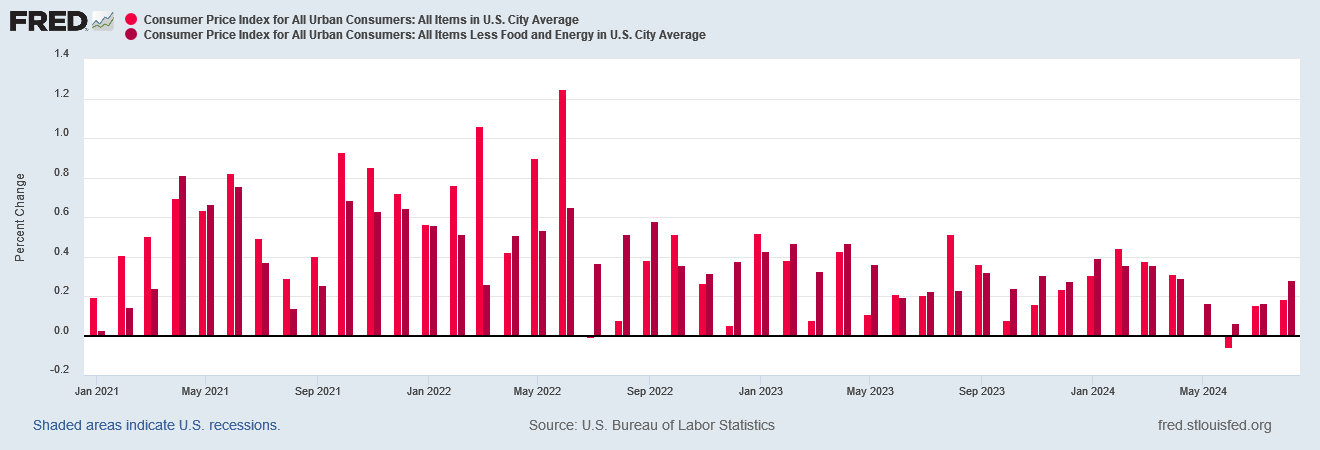
According to the Bureau of Labor Statistics Producer Price Index, producer price inflation did the same thing at the factory gate as consumer price inflation did on the store shelf.
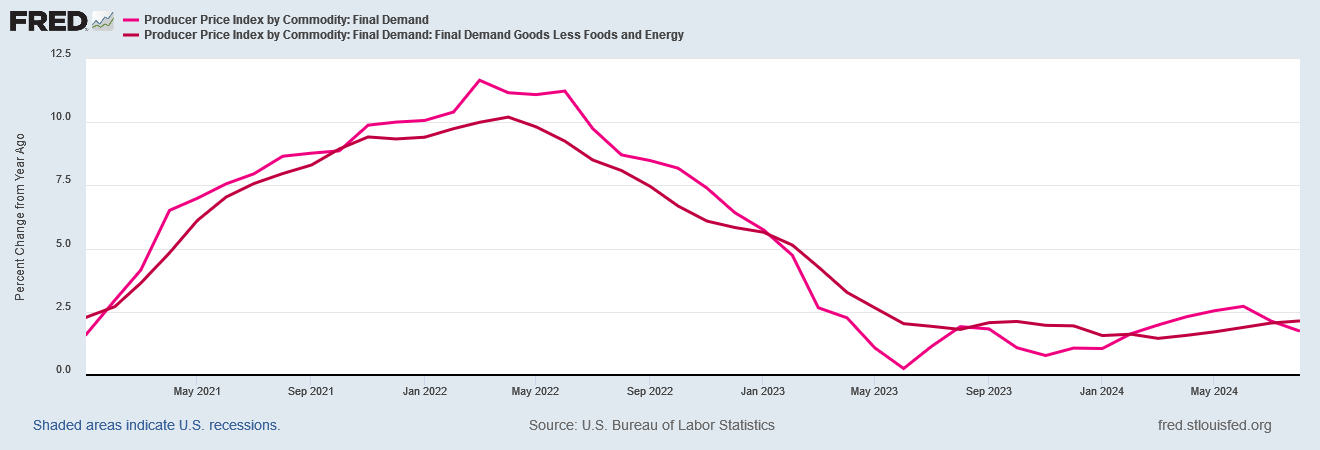
The Producer Price Index for final demand increased 0.2 percent in August, seasonally adjusted, the U.S. Bureau of Labor Statistics reported today. Final demand prices were unchanged in July and rose 0.2 percent in June. (See table A.) On an unadjusted basis, the index for final demand advanced 1.7 percent for the 12 months ended in August.
Does this mean that factory gate inflation—usually the precursor to consumer price inflation—is following the same pattern as consumer price inflation?
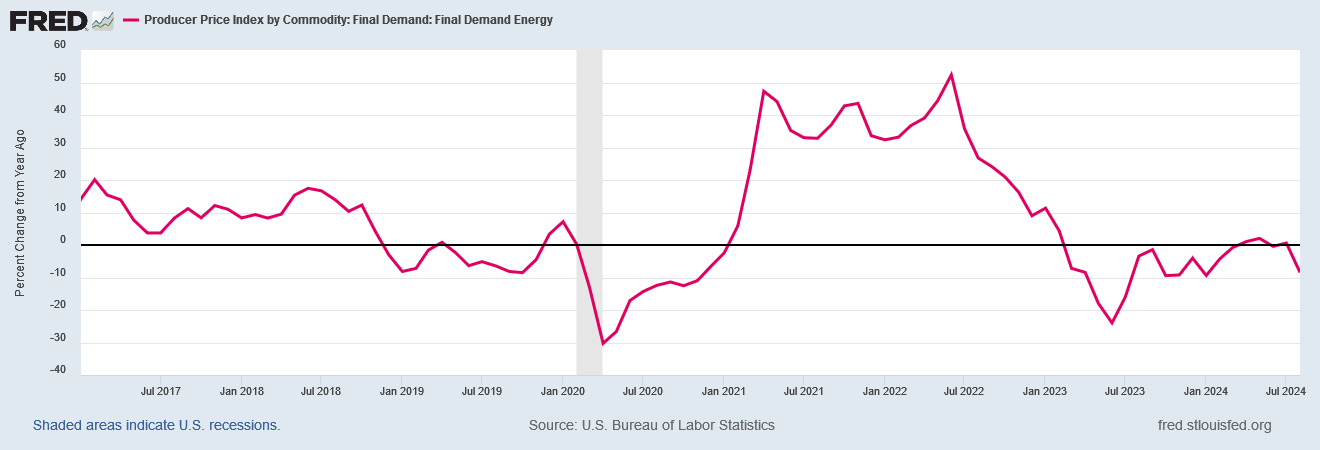
Not entirely. Rather, what we are seeing is the results of persistent energy price deflation on the overall PPI just as with the CPI, which moderates and obscures a higher inflation rate for core goods and services.
Much like with the CPI, the August Producer Price Index showed a decrease in the percent change year on year while printing an increase in the percent month on month. The end result was that factory gate inflation came in both above and below economists expectations.
August Producer Price Index Report: Key Highlights
Headline PPI for final demand slowed to 1.7% year-over-year in August, down from a downwardly revised 2.1% in July. This was slightly below economist expectations of 1.8% as tracked by TradingEconomics.
On a monthly basis, PPI rose 0.2%, surpassing both July’s downwardly revised flat reading and the forecasted 0.1% increase.
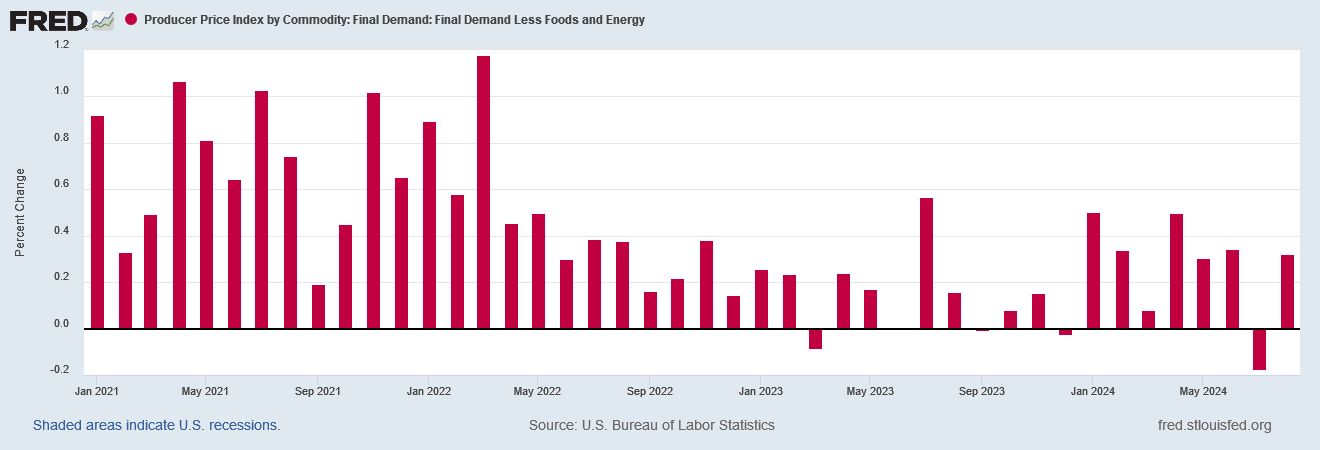
Core PPI (excluding food and energy) held steady at 2.4% year-over-year in August, slightly below market expectations of 2.5%.
On a month-over-month basis, core PPI rose 0.3%, accelerating from the prior downwardly revised 0.2% contraction and surpassing forecasts of 0.2%.
Drilling into the subindices, corporate media also acknowledged that the data was nothing if not “mixed”.
In all, the wholesale inflation data were mixed, though the notable downward revisions for July underscores an ongoing disinflation trend that's welcoming for the Federal Reserve as it gears up to cut interest rates next week. Markets remained confident the central bank's Federal Open Market Committee will reduce borrowing costs by the standard quarter-point increment.
Wall Street chewed the data over and decided it was good, ending the week on an up note.
Is the Producer Price Index telling us anything? Are we looking at more inflation, more disinflation, or even deflation?
Looking at the percent change year on year in the raw data, while headline factory gate inflation has cooled for the past couple of months, core inflation has been rising steadily since March.
Even on a seasonally adjusted basis, factory gate inflation has been trending higher since June of last year.
While we are not seeing consumer price inflation heating up in quite the same fashion, between June of 2023 and March of this year, the year on year percent change in the CPI was moving largely horizontally.
The downward pressures on the CPI from falling energy prices have been moderated by some factor, and that appears to have been factory gate prices.
What is pushing overall factory gate prices higher year on year? Food prices for one.
Energy prices, while still printing deflation year on year, have eased significantly, thus reducing their downward pressure on prices.
However, when we look at the indices themselves, we see that the PPI is showing a structurally higher inflation rate at the core level than from before the COVID Pandemic Panic.
From a charting perspective, inflation is the rate of change in the index. Accordingly, if we fit a trend line to the Core PPI data, first on the data pre-COVID and then where the index graph bends down and the slope moderates again—March 2022, in this instance—the trend post-COVID is steeper than the trend pre-COVID.
Is March 2022 the right inflection point for the “end” of the extreme inflation cycle in the PPI? When we look at the month on month inflation data, we can see that it is, as the monthly changes drop significantly after that date.
This aligns well with the consumer price inflation per the CPI peaking in June of that year.
Focusing on core PPI, we can see that while inflation peaked in 2022, the month on month changes particularly in the past year have been substantial.
When we start to isolate other PPI subindices within the Core PPI, we see that price inflation for core services (Services Less Trade, Transportation, and Warehousing) have been surprisingly stable month on on month even after March 2022.
Trade services, on the other hand, have been flirting with deflation since March of 2022.
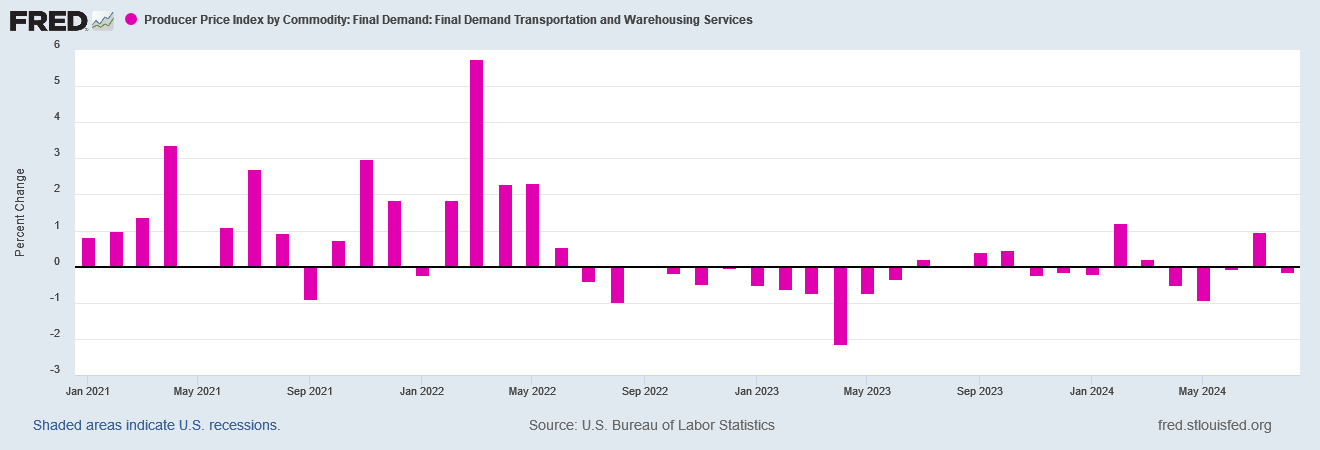
Transportation and Warehousing went into outright deflation by May of 2022, and has largely remained there.
Similarly, Core Goods (Goods less Food and Energy) saw a drop in month on month inflation after March of 2022, very little in the way of actual deflation.
The headline Goods amount (with Food and Energy retained), showed considerable price deflation after March of 2022.
This correlates to the deflationary trend we see in the PPI Energy subindex month on month.
Food prices, on the other hand, went into deflation in late 2022 early 2023, but have firmed up this year.
Once again, we see the fundamental error looking too much to the headline and even the core aggregate index numbers. While there are significant portions of factory gate inflation—and, by extension, consumer price inflation—that are in outright deflation or are remaining at very low inflation (“disinflation”), the broad swath of goods and services at the factory gate level are printing a disinflationary trough.
Services less Trade, Transportation, and Warehousing actually peaked year on year in late 2021, bottomed out in June of 2022, and has been trending up ever since, and in May of this year was even higher than during the 2021-2022 hyperinflation cycle. For their part, Core Goods began bottoming out in May 2023, finally reached a minimum in March of this year, and have been trending up ever since.
This underscores yet again the role that declining energy prices have played in inflation’s retreat from its 2022 heights.
So long as energy prices are coming down in absolute terms—so long as we are seeing energy price deflation—energy prices will exert a significant moderating effect both on the PPI and the CPI, with the one rippling through to the other in a space of approximately 2-3 months.
However, that moderating effect from energy prices exists only so long as we are seeing energy price deflation. The data already shows that the most significant energy price deflation is already behind us.
There is a bottom for energy prices. Once that bottom is reached the moderating effect of energy price deflation on both factory gate inflation and consumer price inflation ends. At that point, the structurally higher inflation rates we are seeing for core goods and services will come to the fore, and we will see inflation rates rising not just at core levels but at headline levels as well.
The CPI data said headline inflation is still trending down. That same CPI data said core inflation may have bottomed out.
The PPI data says we should enjoy both downward trends while they last, because structurally higher inflation lies ahead, and is likely to remain for an extended time.












Energy prices, food and insurance costs are still punitive compared to affordability. Southern California’s last two months of record heat, has delivered utility bills looking like mortgage statements, and wages are not keeping up. In addition, 1.5 trillion in commercial loans are coming due in 2025 and office buildings are not anywhere near occupancy pre-COVID
Thank you for another smart, comprehensive analysis, Peter. You always manage to put together the kind of accurate picture that people need to make decisions. That’s really impressive!
Unfortunately for Trump, there’s too much data here that Harris can spin to her benefit. Trump needs a clear indication that Bidenomics is NOT working for consumers. Peter, are you seeing any brand new trends beginning - maybe a jump in energy prices just this month, or something similarly significant - that would work to Trump’s favor? We need some clear, big signal within the next forty days!