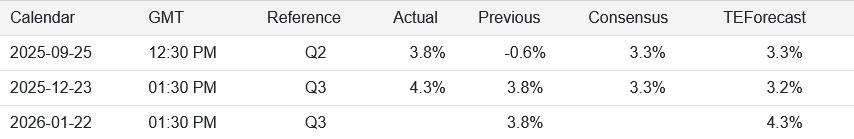
Real gross domestic product (GDP) increased at an annual rate of 4.3 percent in the third quarter of 2025 (July, August, and September), according to the initial estimate released by the U.S. Bureau of Economic Analysis. In the second quarter, real GDP increased 3.8 percent.
Due to the recent government shutdown, this initial report for the third quarter of 2025 replaces the release of the advance estimate originally scheduled for October 30 and the second estimate originally scheduled for November 26.
Longtime readers already know how much stock I put in headline numbers—damn little.
There is no denying that a mature economy such as we have in the United States is doing extremely well if it can print a 4.3% annual growth rate in any quarter. When that growth rate comes on the heels of a 3.8% annual growth rate in the previous quarter, the number seems all the more impressive.
If we peel back the layers and look at the data underneath, however, should we continue to be impressed?
No.
We must always remember that an economy does not exist merely as a point in time, but spans time. Growth today means little if it does not translate into growth tomorrow. Expansion today is arguably damaging if it produces contraction tomorrow.
When we drill into the 3rd Quarter GDP data, we do not see data which suggests either growth or expansion tomorrow. We might even be looking at data which augurs contraction tomorrow.
Either scenario is a problem.
The Trump Administration’s victory cheers are ignoring the storm clouds which lie ahead.
Every article I publish takes time, care, and independence. A paid subscription fuels that work and shields it from outside pressure. If you are able, please subscribe today.
The Victory Lap — Is It Deserved?
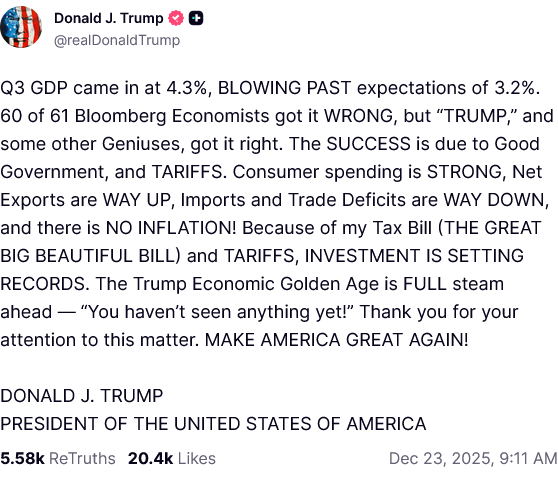
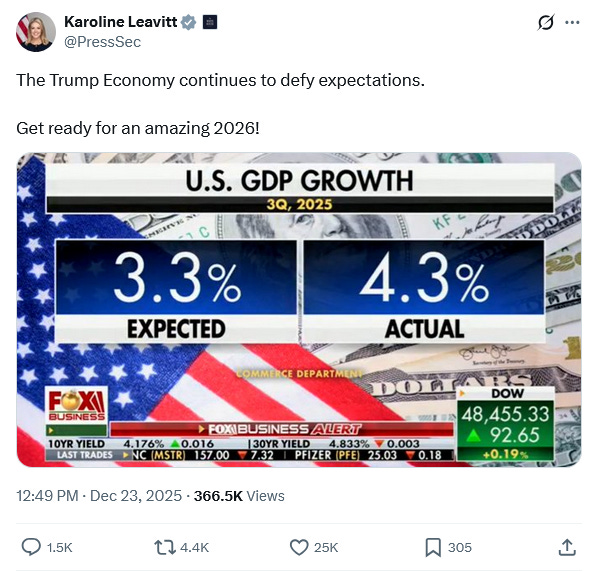
We should not be surprised that the Trump Administration jumped on the BEA’s growth estimate for the 3rd quarter. With a Real GDP growth rate of 4.3% for a headline number, the surprise would be if they did not brag about it.
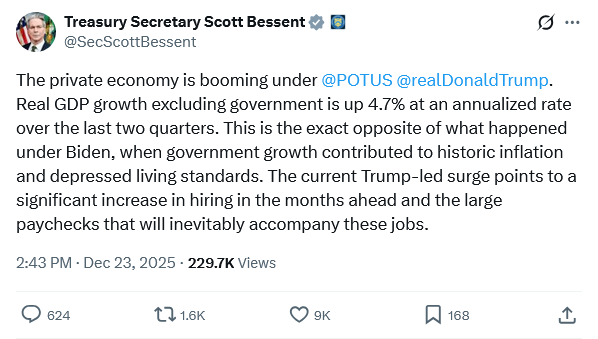
From President Trump on down, brag is exactly what they did.
The economists whose jobs involve scrutinizing those statistics to glean what they really mean don’t view them as unalloyed support for Trumponomics. Quite the contrary. Many see them as artifacts of the long government shutdown, which halted the collection of data that go into those reports, severely distorting the results. Furthermore, they expect the flaws in those reports to persist well into 2026, undermining their usefulness as true economic indicators.
While there are good reasons to put more than a few caveats on the headline number, the Silly Schumer Shutdown is not one of them. The third quarter ended on September 30, and the shutdown began on October 1. While the actual data processing for the third quarter was understandably delayed due to the shutdown (last week’s release normally would have come in late October), the data itself predates the shutdown. Even with the shutdown, much of the data involved in quarterly GDP estimates is historical in nature, which means the data set itself is largely complete even if the analysis has been delayed. Numbers, unlike fish, visitors, and political talking points do not start to smell after three days.
What are those caveats which we have reason to apply? They go back to the contexts I mentioned earlier: is the growth sustainable or is it taking the economy up only to see it crash down to earth again?
Understandably, the Trump Administration wants everyone to believe that the growth is sustainable—indeed, that the growth is just getting started, and 2026 will see even better growth rates.
Does the data support that belief? No. Quite the contrary, the data raises multiple questions about where the economy is actually headed.
Consumption Today, But What About Consumption Tomorrow?
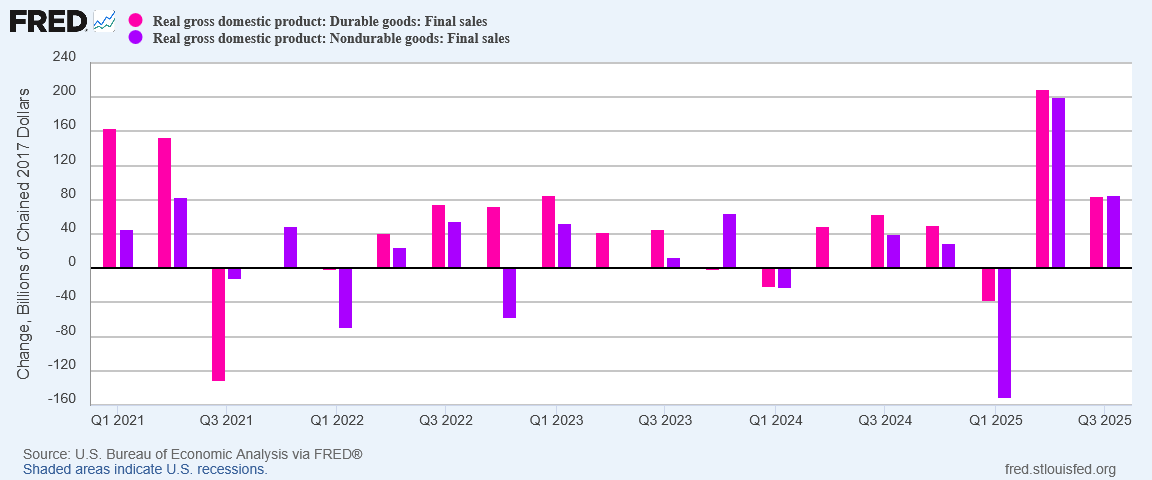
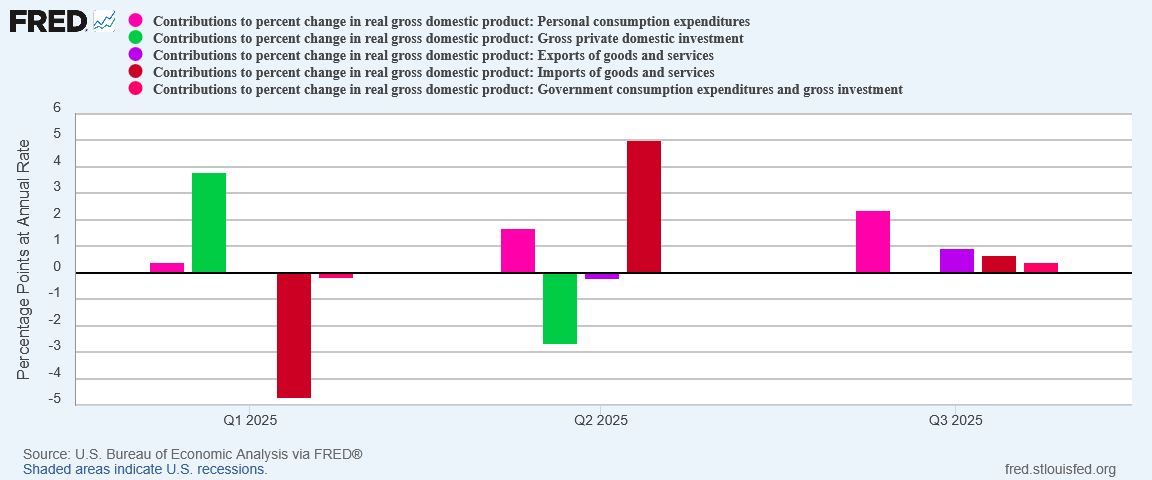
As is usual within the US economy, consumption powered much of the recorded GDP growth.
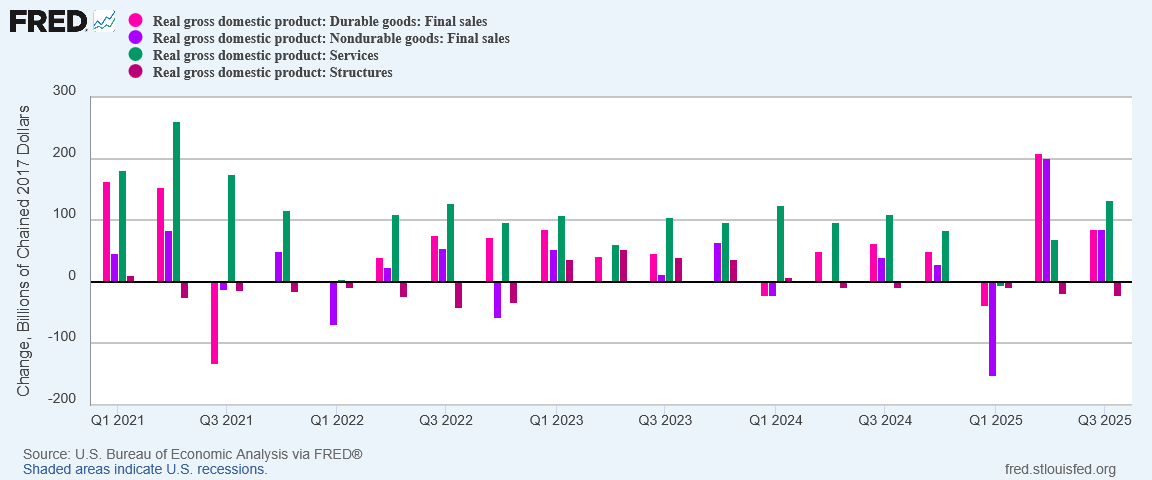
However, when we look at the final sales of goods—of actual “things” sold in the United States—in real terms, the third quarter growth was significantly less than in the second quarter.
While the third quarter growth in goods’ sales of $170 Billion is still stronger than what we have seen since the early days of the Biden Administration, it is less than half the $411 Billion recorded in the second quarter of this year.
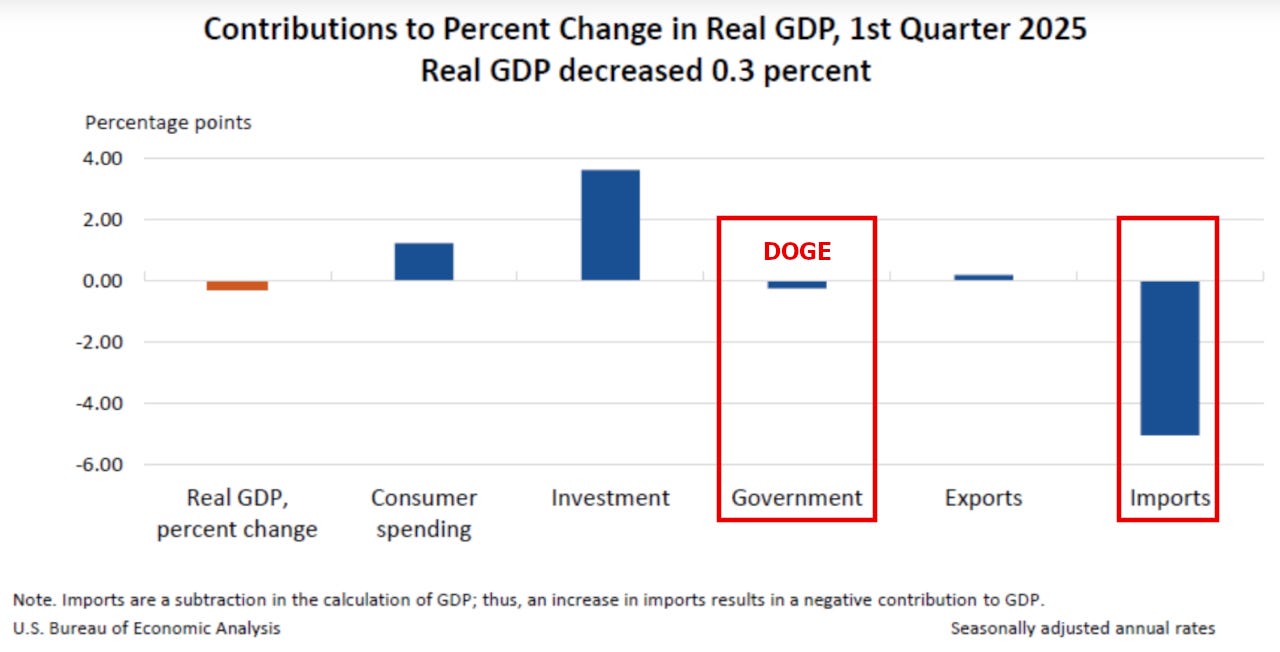
This is cause for concern, because the usual assessments of defensive front-loading of purchases to navigate around President Trump’s Liberation Day tariffs does not hold up. Once again, the calendar is the reason why: The tariffs were announced at the beginning of the second quarter. Defensive front-loading was the import behavior we saw during the first quarter, and was a primary reason first quarter GDP printed negative.
There was no dramatic defensive front-loading in the second quarter, which means the 60% drop in goods sales from the 2nd to the 3rd quarter represents a clear deceleration in purchasing activity.
Deceleration is not the same as contraction, but neither is the same as acceleration.
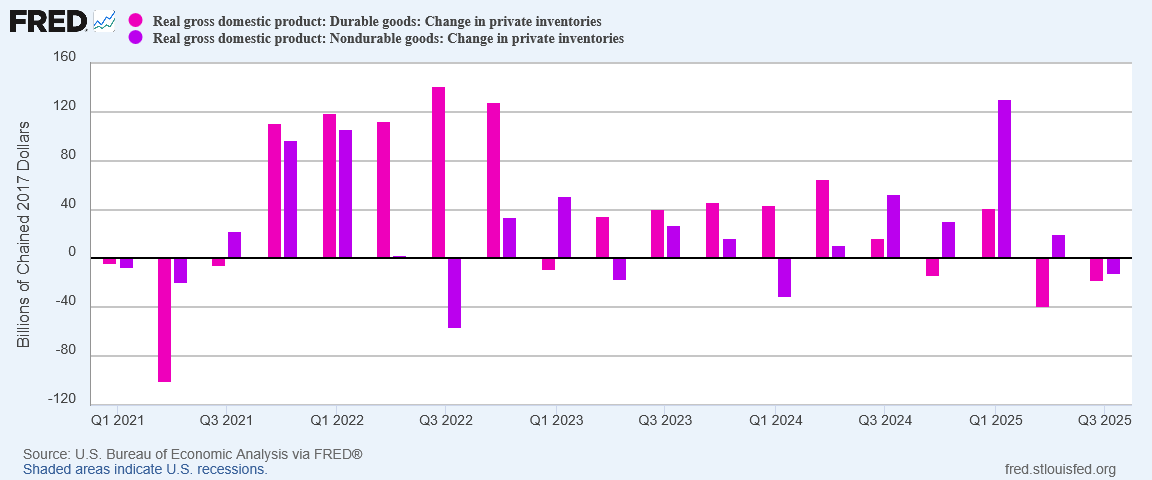
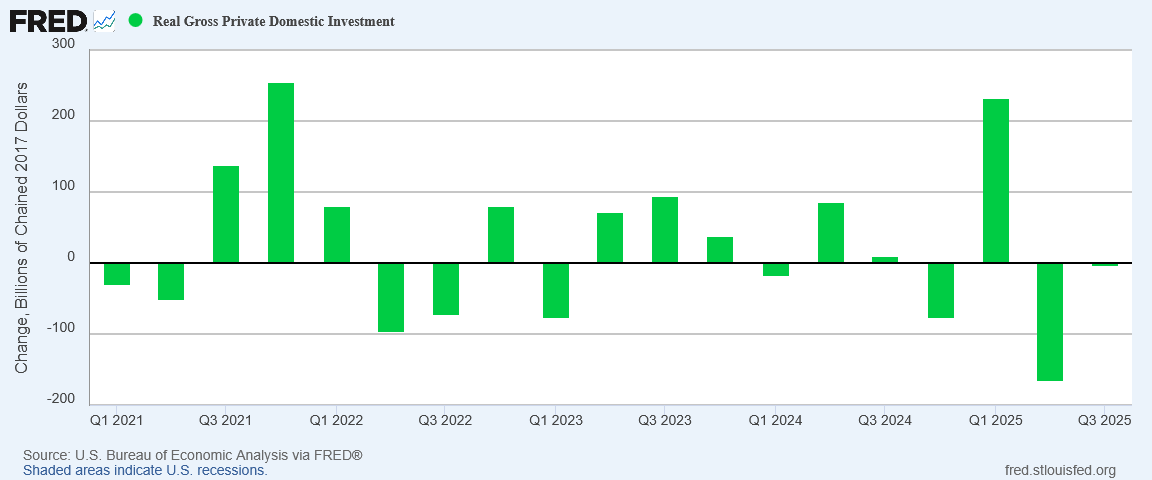
Durable goods inventories declined for the second straight quarter. Non-durable goods posted a decline after a sharp second-quarter deceleration from the first quarter’s clearly defensive inventory build.
However, if demand for goods is increasing, why did actual sales fall? And if demand is falling—a likely inference from the reduction in actual sales—why did inventories not grow?
The realities of supply chain logistics are inescapable: if goods are not first purchased they cannot be resold.
For non-durable goods we can see a clear defensive build during the first quarter—almost certainly in anticipation of tariff-driven inflation effects—but there is no clear defensive inventory build for durable goods. Instead, we see a relatively unremarkable inventory build in the first quarter, with declines in the subsequent quarters despite a surge in durable goods sales in the second quarter.
Is the third quarter decline in non-durable goods inventories a lingering result of the first quarter defensive build? Possibly—although the surge in second quarter non-durable goods sales coupled with a much smaller inventory build argues strongly for second-quarter consumption of the first quarter inventory surge.
Is the inventory decline a sign of increasing demand (and thus economic growth) or an indicator of declining confidence in future demand (and thus an expectation of an economic slowdown)?
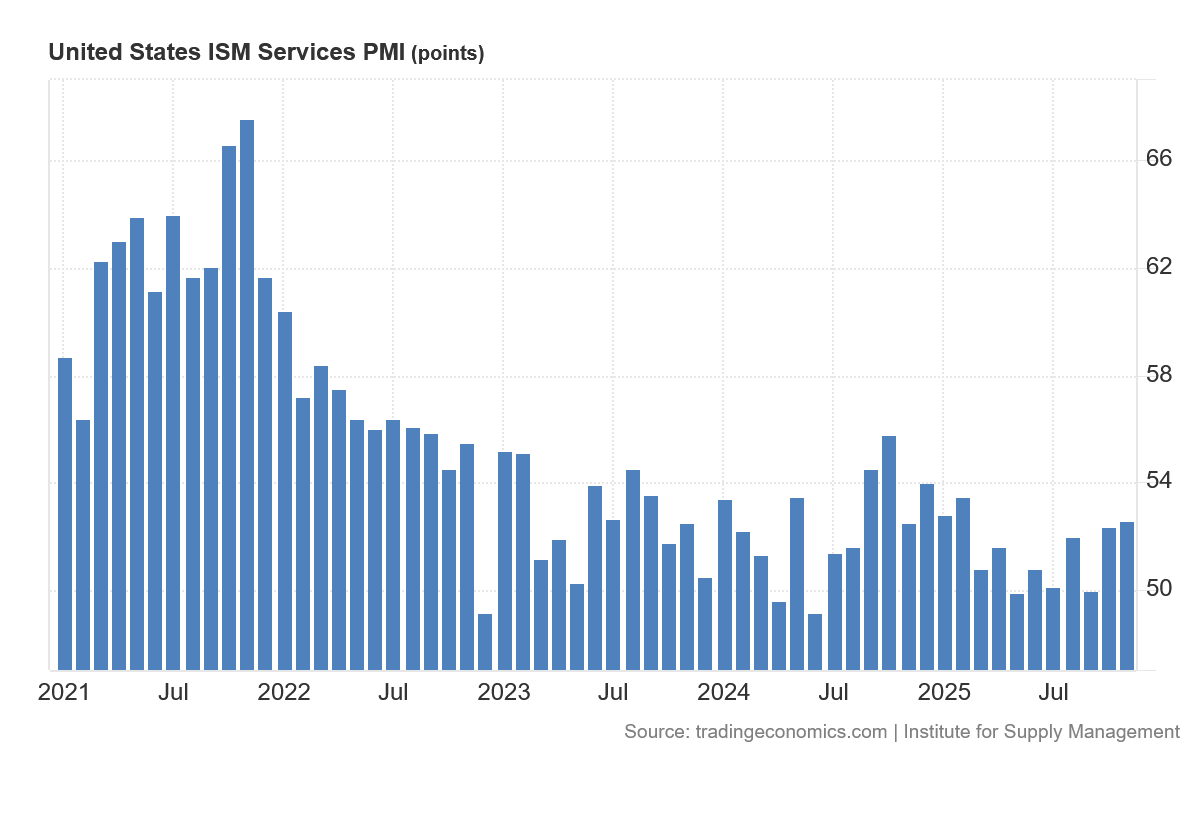
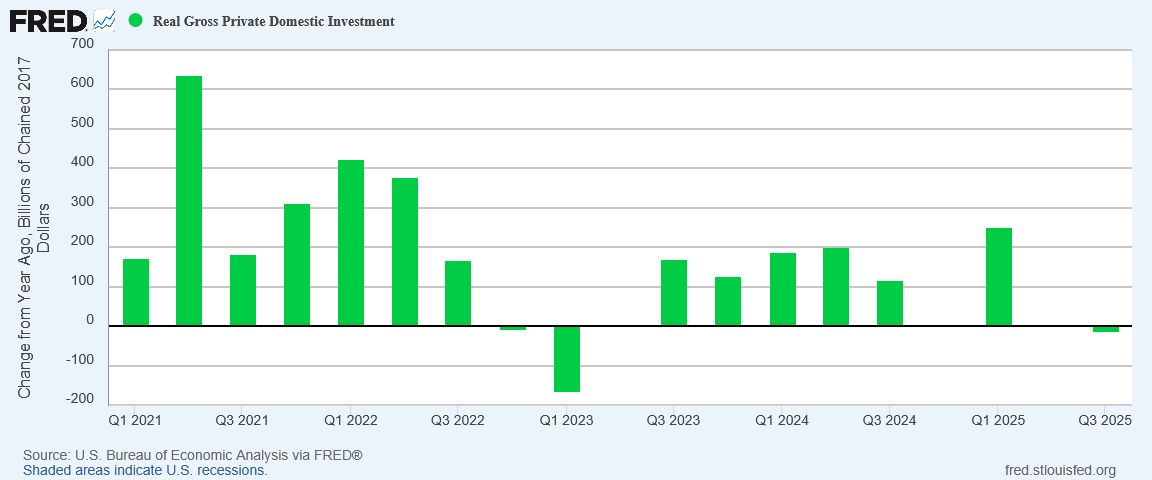
The strong growth rebound of 2021 and 2022—the obvious boomerang effect from the forced contraction of the Pandemic Panic—was a spent force by 2023, and since then growth even in services has been diffident and uneven.
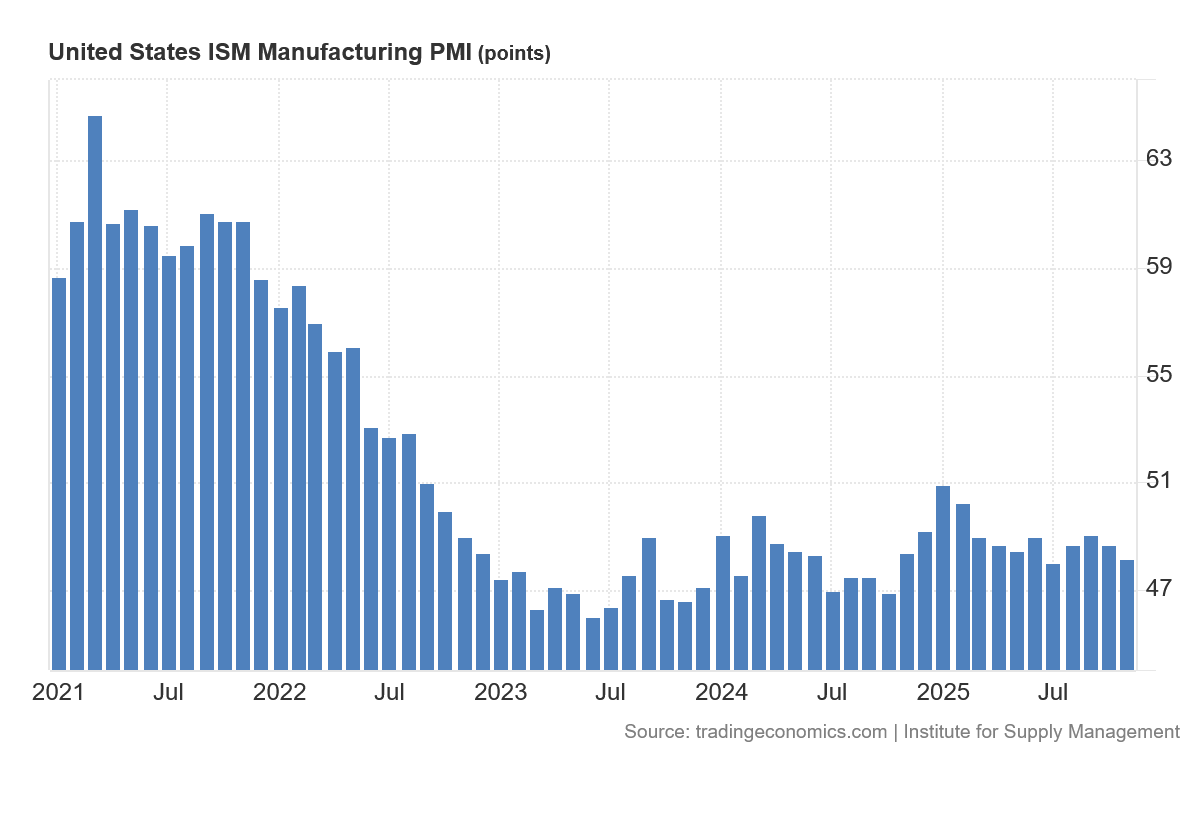
Growth in manufacturing has been nonexistent, based on the ISM data.
With no growth in manufacturing and only modest growth in services, coupled with successive quarters of inventory declines, what will power consumption in future quarters?
The BEA’s 3rd quarter GDP data does not give a clear answer to that question.
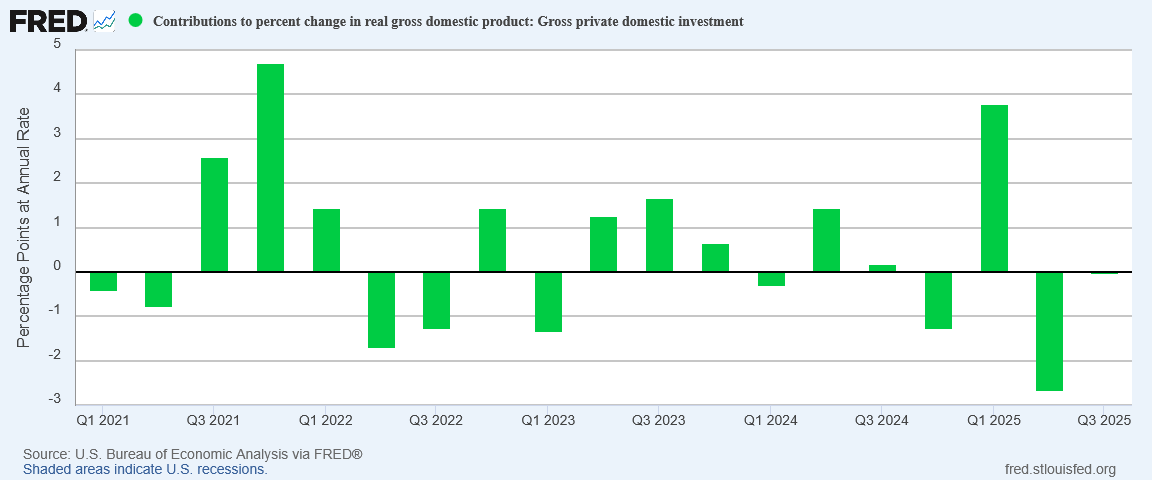
Economic investment is the precursor to jobs, the precursor to production, the precursor to economic output across the board. Economic investment is the font of future economic consumption.
If investment is not contributing to GDP growth in the present, that does not augur well for consumption’s contribution to GDP growth in the future.
Remember, growth today means little if it does not translate into growth tomorrow. If we are not investing in the US economy, today’s consumption is arguably of diminished importance, as it does not translate into consumption tomorrow.
The role of housing in the US economy is proving to have awkward parallels to China.
While we are not seeing a complete collapse in housing valuations such as China has been experiencing since the Pandemic Panic, we are seeing housing values starting to stagnate.
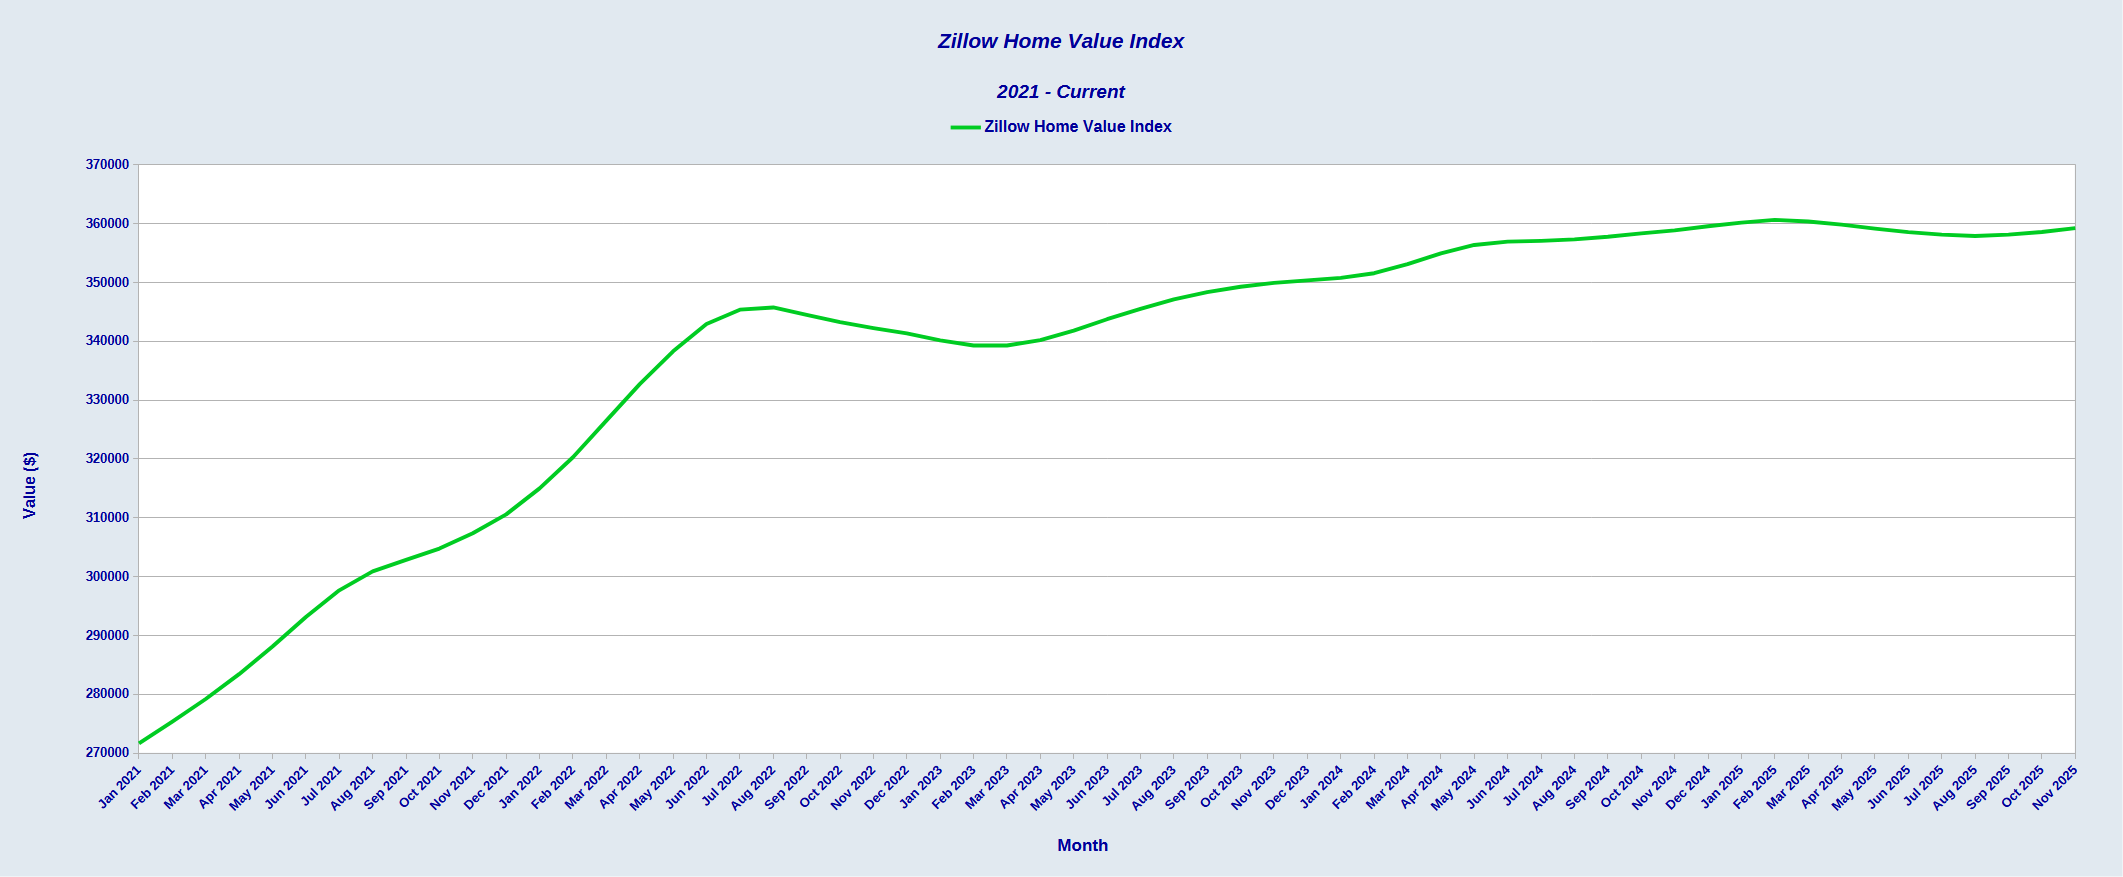
When we look at the private-sector Zillow Home Value Index, we see that home valuations have not risen scarcely at all since the start of the year.
Home valuations rose significantly following the Pandemic Panic before starting to stabilize in mid-2022, experiencing even a modest decline into the spring of 2023. While home valuations recovered somewhat in 2023 and 2024, since the start of the year there has been little if any growth.
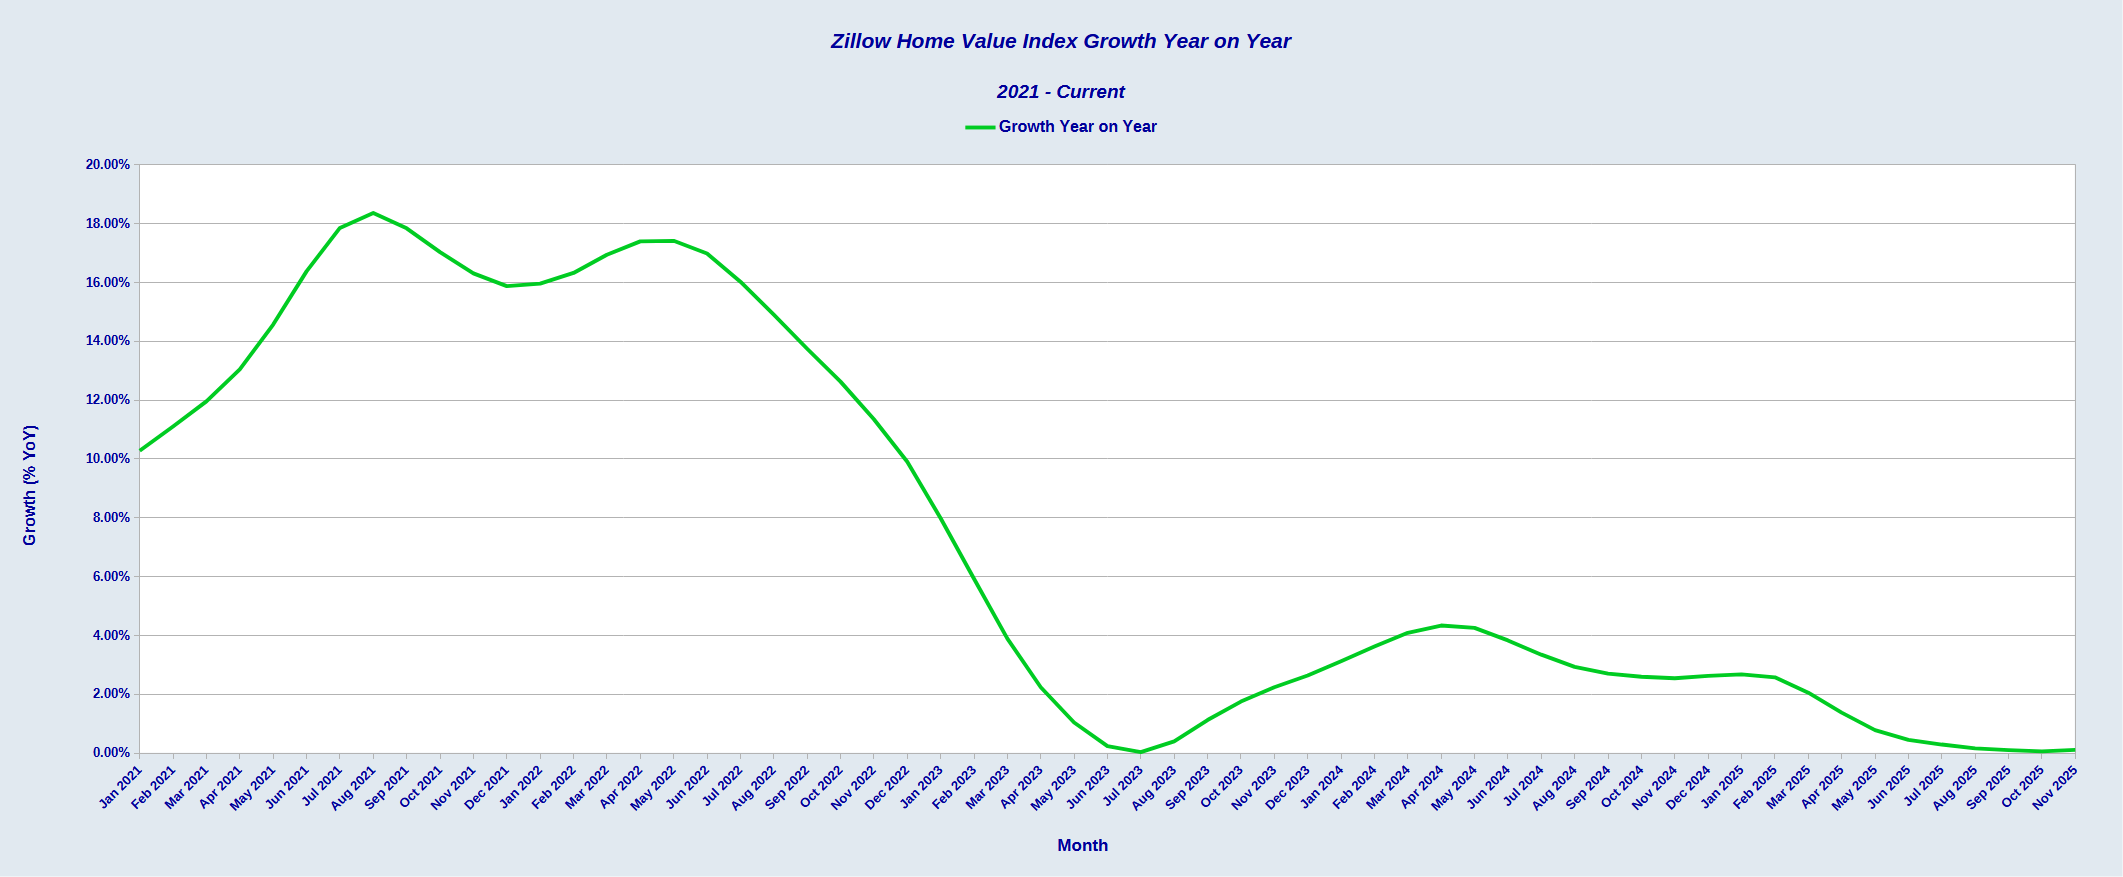
If we look at the percentage growth year on year, we see that home valuations have stopped rising for all intents and purposes.
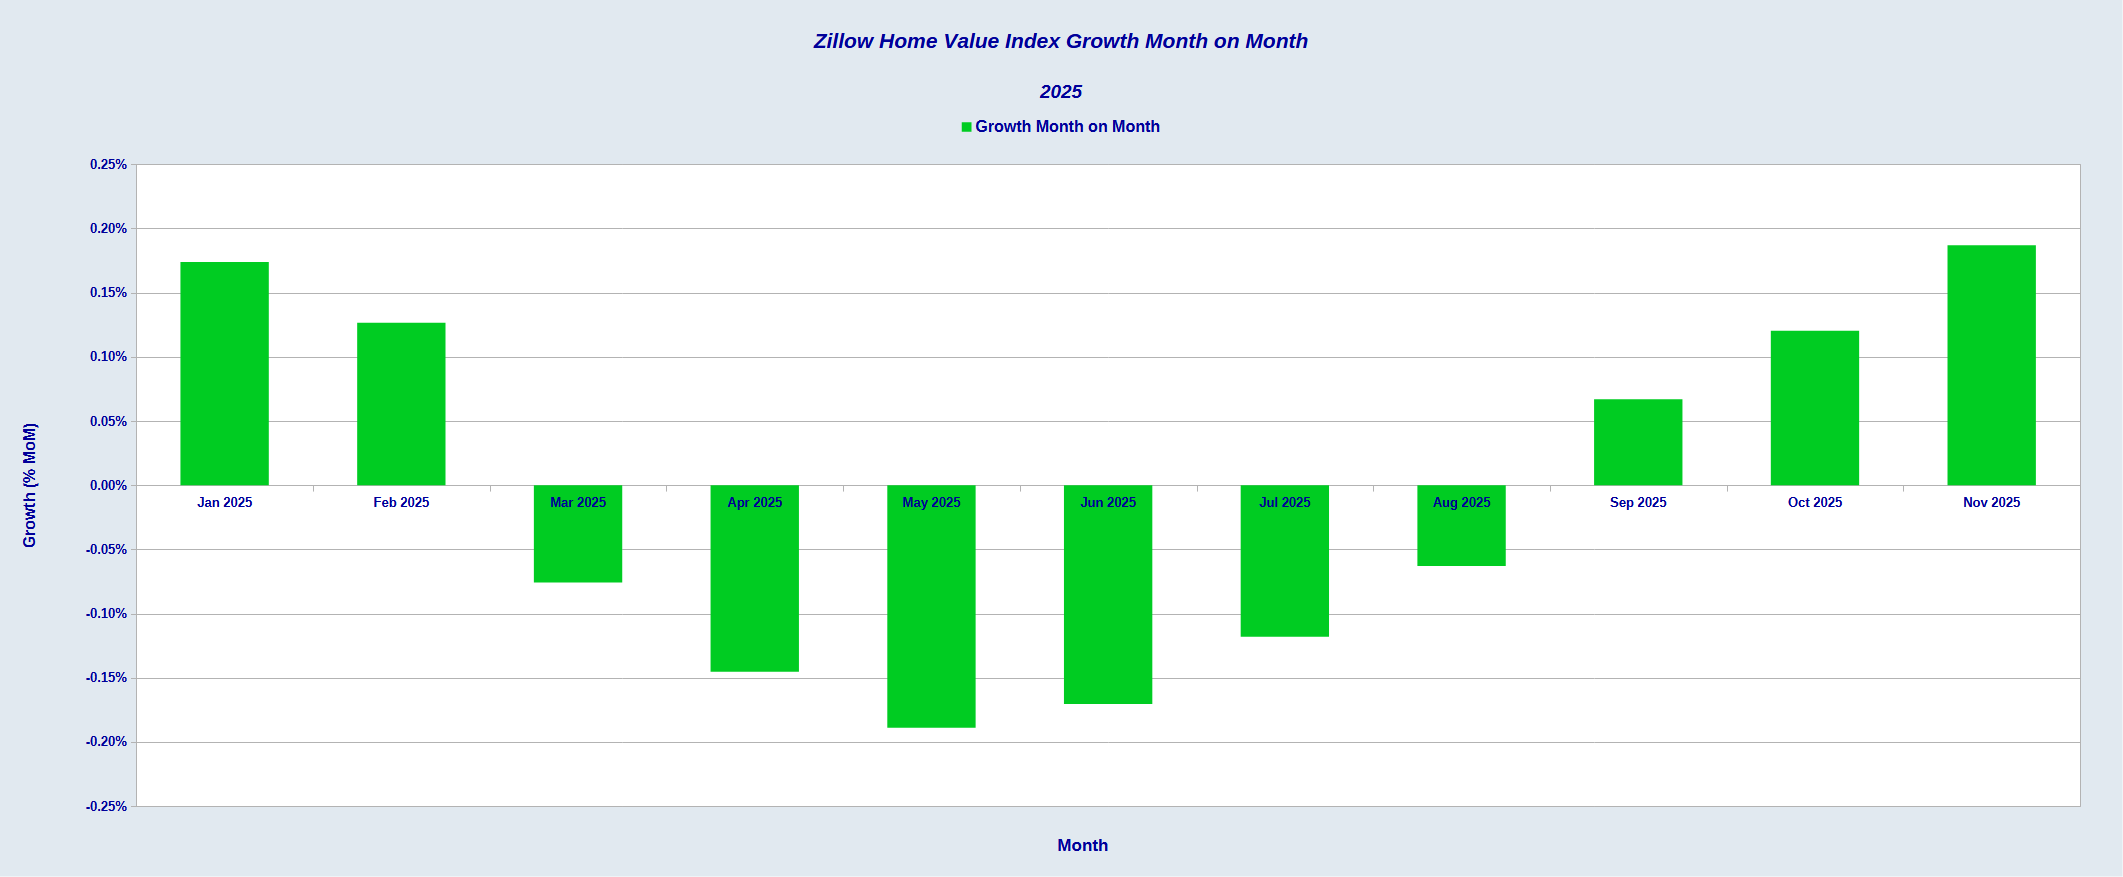
If we zoom in on 2025, we see that, month on month, home valuations declined in the middle of the year, returning to growth only in the last few months.
The moribund home valuation data reflects another grim reality in the US economy—problematic and even falling sale prices for homes.
What sounds like welcome news for frustrated buyers is actually a warning sign for the wider economy.
Falling prices make homeowners feel poorer, pull down household spending, drag on confidence, and can trigger deeper trouble in markets already stretched by high mortgage rates and shrinking savings.
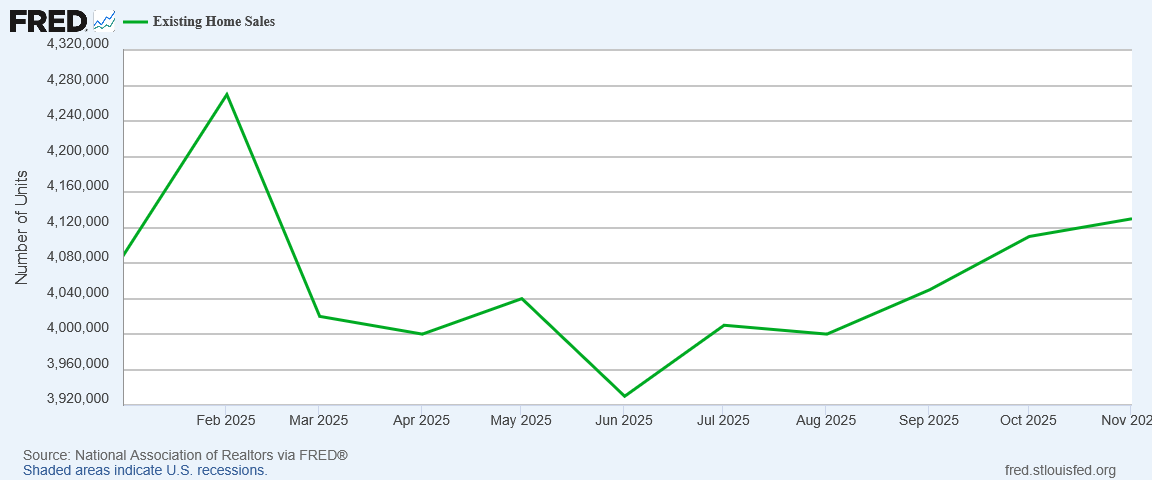
While this may be overstating the situation by a wide margin, there is no denying that the decline in home valuations has been matched by a similar dropoff in existing home sales.
Home valuations and home sales are synergistic, just as is the case for any good or service. Greater demand (higher sales) pushes values higher, and higher values signal greater demand.
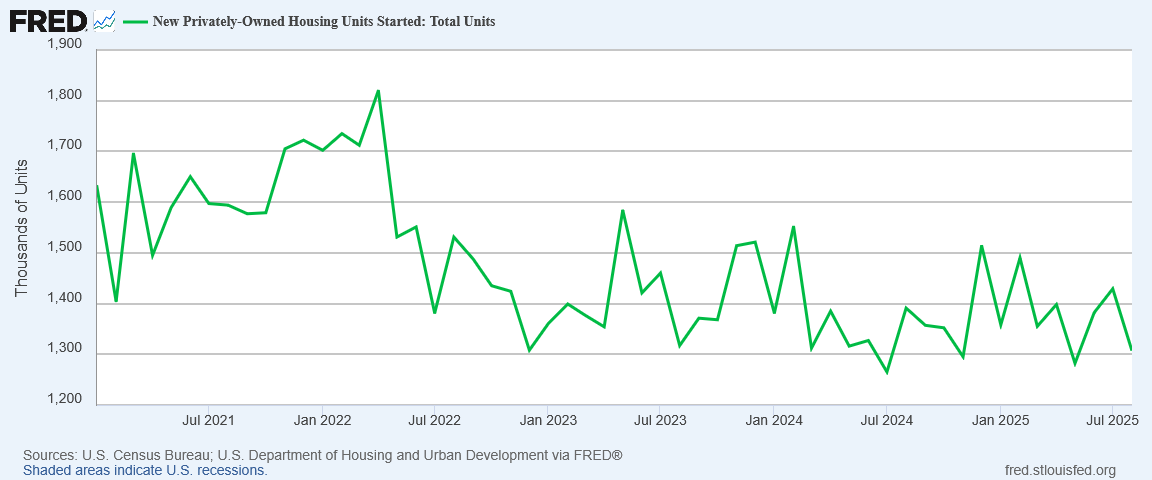
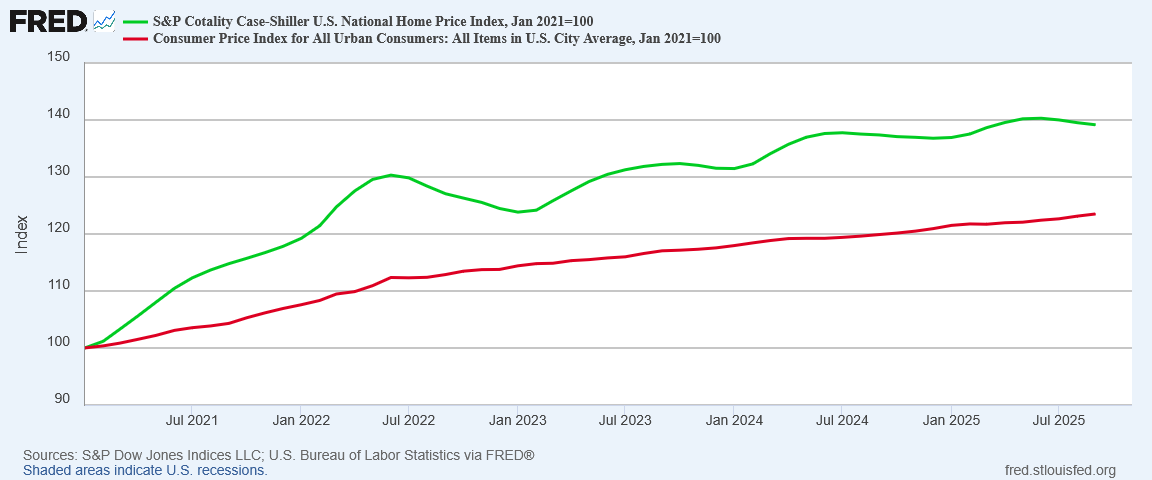
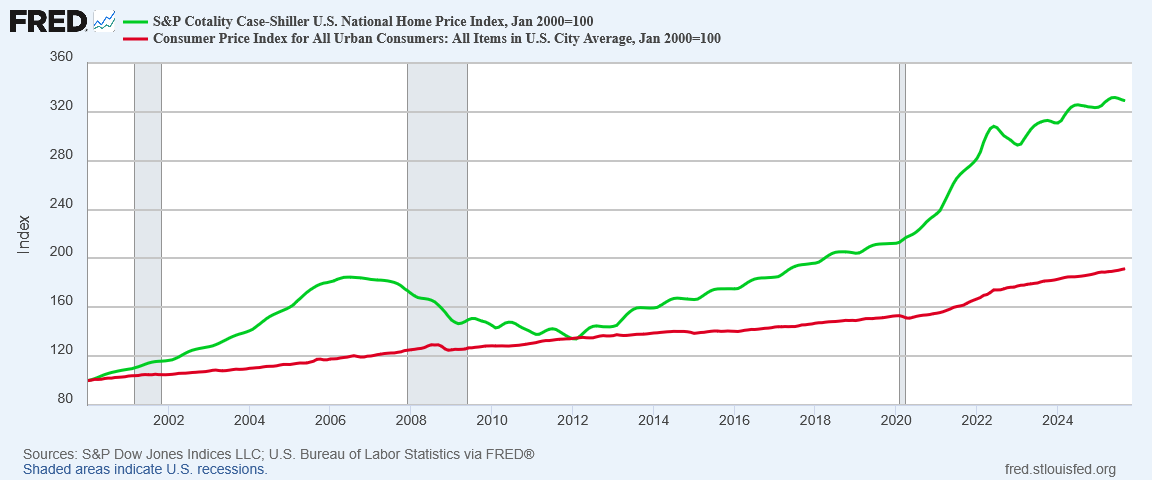
Even though housing arguably has not been displaying the frothy characteristics typical of asset bubbles—problematic sales and housing start data argues strongly against there being a housing bubble at present—we are nevertheless seeing a measure of distortion in housing prices relative to overall inflation which is currently greater than what we saw at the peak of the sub-prime mortgage bubble in 2006.
Is there a correction coming in housing markets? Certainly it is difficult to sustain a value argument to justify home prices rising persistently faster than overall inflation.
As a side note, housing price data such as the Zillow data and the Case-Shiller index are why the shelter price component of the CPI must be taken with a grain of salt. The shelter price data within the CPI is structurally backward looking, making it more reflective of past price shifts rather than current price shifts.
If there is a coming collapse in housing prices—or a surge in consumer price inflation to bring the rest of consumer prices up to match the rise in housing prices—the effects on the broader economy would be quite negative. We might not be looking at China levels of negative, but we would certainly be facing a major economic dislocation on par with the Great Financial Crisis.
Contrary to the TDS-inflected hand-waving of corporate media regarding the 3rd Quarter GDP Estimate, we do not have great reason to simply disregard the BEA’s estimates. Given that the third quarter ended before the Silly Schumer Shutdown, the likely impact of the shutdown on the third quarter data is likely minimal beyond the publication delay which we have already seen. Whether the Silly Schumer Shutdown will have significant impact on the fourth quarter and 2025 final numbers remains to be seen, although the timing again is likely to have minimal impact—the BEA will have had, by the end of the year, ample time to compensate for data collection disruptions during October.
However, what both the Trump-deranged corporate media and the Trump Administration are overlooking is how well—or how poorly—the third quarter data positions the US economy for future growth.
While hyperinflation chokes off economic growth, it is difficult to achieve economic growth without some measure of inflation, simply because any expansion of consumer demand especially is by definition an inflationary pressure on prices.
With both the BLS CPI data and the BEA’s own Personal Incomes and Outlays data reflecting a cooling outlook for inflation, how much economic growth can be projected from the third quarter GDP data is uncertain to say the very least.
There was consumption growth during the third quarter, and so there was economic growth during the third quarter. Superficially, that is indisputable. On that basis, the Trump Administration’s victory laps are justifiable.
Will there be similar economic growth in future quarters? The data does not lend itself to such optimism.
This is not to say that there won’t be emerging factors in 2026 which will power robust economic growth. Perhaps the presumed benefits of Trump’s “One Big Beautiful Bill” will indeed stimulate the economy to new levels of sustainable growth. Perhaps the tax reductions President Trump has been promising will help stimulate consumer demand. Whether or not such outcomes are probable is not something we can assess from the data at hand, but such outcomes are certainly plausible possibilities and we should not dismiss them out of hand.
However, neither should we ignore the problematic signals and outright alarms within the third quarter GDP data, and in the surrounding data we get from other sources. Inventory declines when goods sales are decelerating does not augur well for future growth in goods sales.
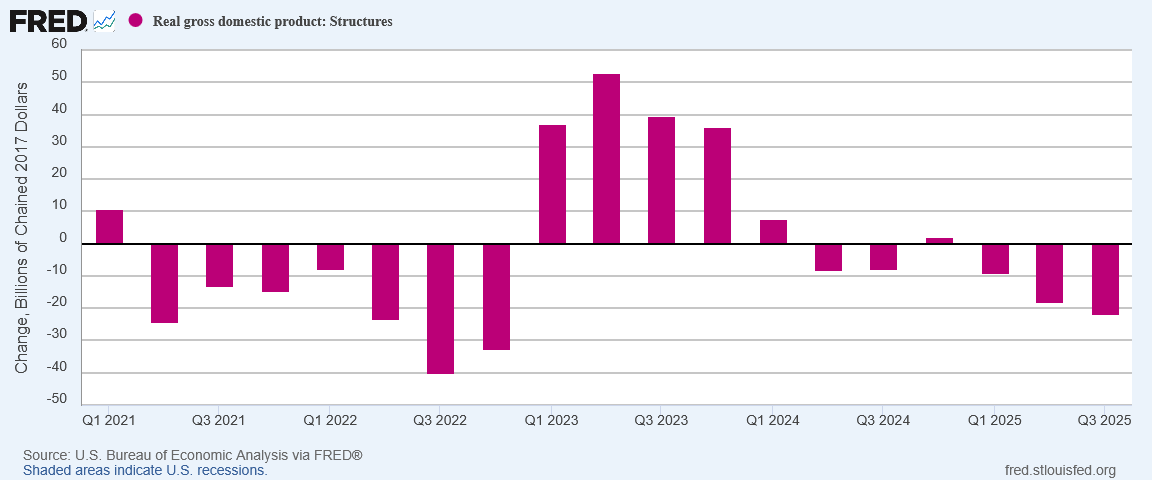
Declining contribution to GDP from structures indicates we are building less and less. Coupled with weak investment, this is a signal that we are building future economic growth on less and less economic infrastructure, and that is not a recipe for economic success at any level.
That weak investment data also tracks disturbingly well with a continued decline in US manufacturing. If the US does not start making more “things” future economic growth will be sketchy at best.
If the US does not start creating more jobs there will not be the future paychecks necessary to drive continued consumption growth. People need to be earning an income in order to be consuming on a sustainable basis. There is no escaping those mathematics.
How will the US deal with the large distortion in housing prices? That’s a very good question, but one that neither the Trump Administration nor the Trump-deranged corporate media cares to answer. That lack of attentiveness to a major economic driver has zero chance of ending well for the US economy.
Yes, the third quarter GDP numbers look good on the surface. Yes, they show economic growth today.
Economic policy, in order to be successful, has to look past today. “Seize the day” might be a tempting lifestyle choice, but it is an abysmal economic one. People need economic policy that goes farther than simply carpe diem. Washington, Wall Street, and Main Street need to be looking ahead if the future is to turn out at all well.
The Trump Administration is celebrating the economic data for today. The Trump-deranged corporate media is casting aside the economic data for today. Neither is looking at what the economic data might be for tomorrow.
If this story gave you real value, help me keep going. All Facts Matter is powered by readers who believe facts should stand on their own. Your subscription makes that possible.
Peter, you are so amazingly good at data analysis. Each paragraph shows your genius at exposing the superficial data and peeling back the layers. I am endlessly impressed.
I’m glad Trump has some numbers to shore up his campaigns. Even if he ends up being substantially wrong, his numbers continue to destroy the anti-Trump forces who have been looking like idiots, with their cries of “tariffs will cause huge inflation!” and other Trump Derangement Syndrome symptoms.
I suspect the big economic story of 2026 will be one of contagion, ripple effects, and dominoes from the rest of the world. Half of the world is now seriously unstable, politically and economically. Whether you look at China, Russia, Iran, the EU, Venezuela, or large parts of Africa, there are so many places teetering on the edge of massive change that the effects on the U.S. economy will be substantial and unpredictable. We are in for an extremely interesting 2026! (Yes, as in the ancient curse of “May you live in interesting times”!)
I’m looking forward to your genius articles about it all, Peter. Thank you in advance!