As something of a follow up to my last article, outlining the distortions and variances within shelter price inflation, I would like to discuss an interesting blog essay from New York Federal Reserve economist Julian di Giovanni, regarding another dissection of inflation’s origins.
As I noted in my last article, shelter price inflation has been highly distortive, and depicts yet another dimension in which the nation’s economy is out of balance.
In his essay, Julian di Giovanni presents another way in which inflation distorts an economy, through the confluence of aggregate demand increases and supply side dislocations1.
I will note that in discussing di Giovanni’s decomposition of the drivers of inflation I am making the assumption that the Fed’s rate hikes are effective against inflation. Regular readers will no doubt recall that I have challenged that assumption multiple times in the past, and I still do. However, di Giovanni’s model presents an interesting exploration of the “best case” for the Fed’s inflation strategy, and that is what I am pursuing here.
Di Giovanni bases his breakdown of the composition of consumer price inflation on a model devised in a paper he presented to the European Central Bank2 earlier in the summer to assess the economic impacts of the 2020 lockdowns.
We study the effects of the Covid-19 pandemic on the Euro Area inflation
in comparison to other countries such as the United States over the two-
year period 2020-21. Our model-based calibration exercises deliver four
key results: 1) Compositional effects – the switch from services to goods
consumption – are amplified through global input-output linkages,
affecting both trade and inflation. 2) International trade did not respond to
changes in GDP as strongly as it did during the 2008-09 crisis despite
strong demand for goods. These lower trade elasticities in part reflect
supply chain bottlenecks. 3) Inflation can be higher under sector-specific
labor shortages relative to a scenario with no such supply shocks. 4)
Foreign shocks and global supply chain bottlenecks played an outsized
role relative to domestic aggregate demand shocks in explaining Euro
Area inflation over 2020-21. These four results imply that policies aimed
at stimulating aggregate demand would not have produced as high an
inflation as the one observed in the data without the negative sectoral
supply shocks.
This time around, di Giovanni builds on that model to assess the role of supply chain bottlenecks and other dislocations in driving consumer price inflation.
As di Giovanni and others articulated in a blog essay from January3, there is a global dimension to the present inflation.
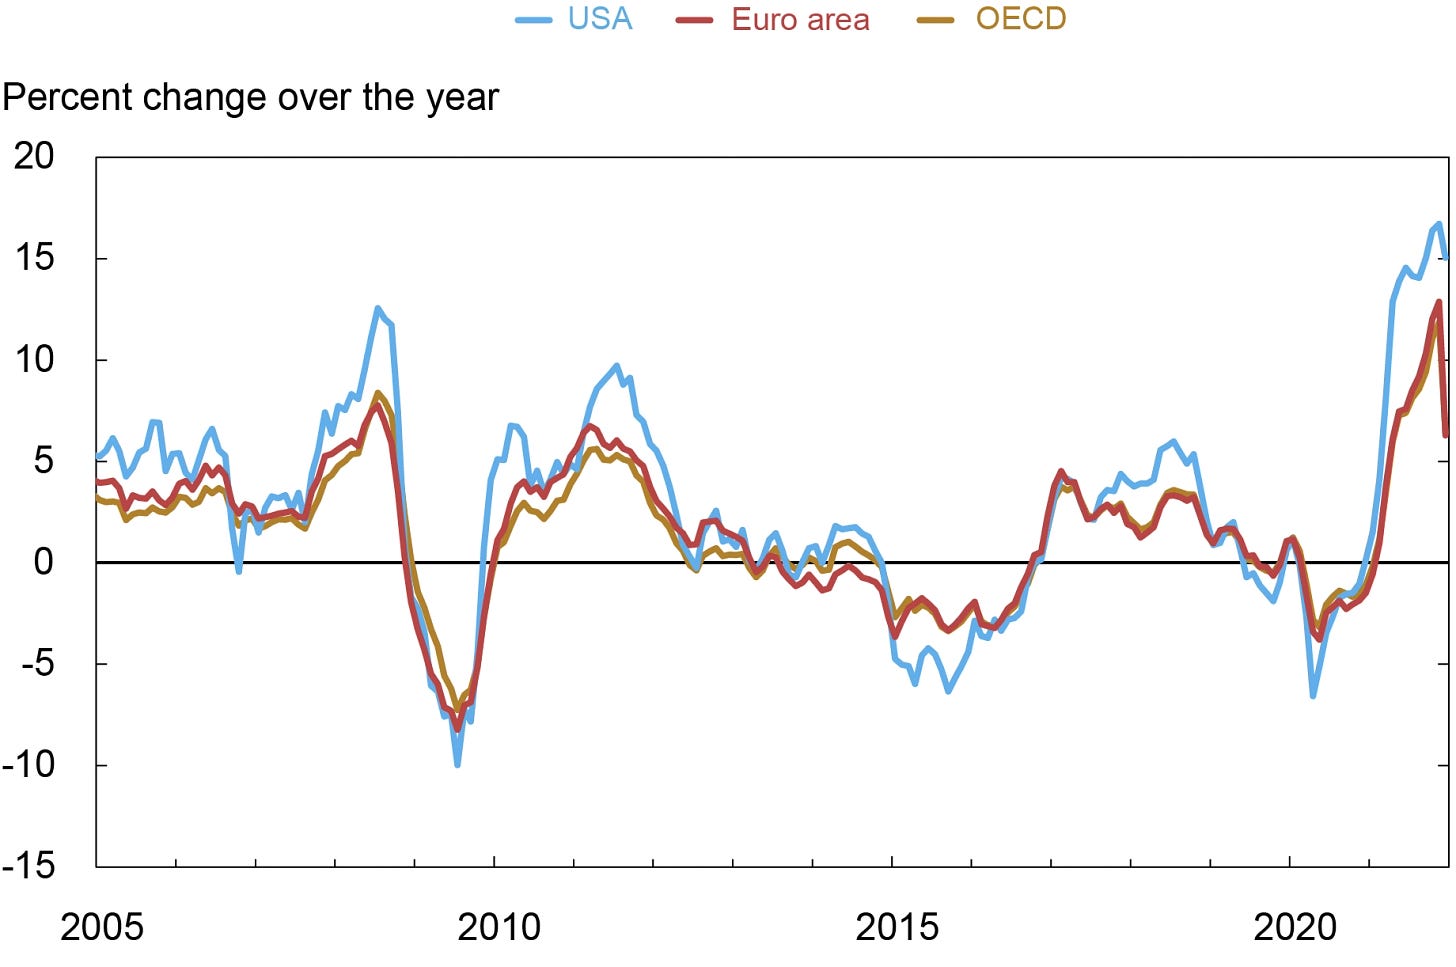
U.S. inflation has surged as the economy recovers from the COVID-19 recession. This phenomenon has not been confined to the U.S. economy, as similar inflationary pressures have emerged in other advanced economies albeit not with the same intensity. In this post, we draw from the current international experiences to provide an assessment of the drivers of U.S. inflation. In particular, we exploit the link among different measures of inflation at the country level and a number of global supply side variables to uncover which common cross-country forces have been driving observed inflation. Our main finding is that global supply factors are very strongly associated with recent producer price index (PPI) inflation across countries, as well as with consumer price index (CPI) goods inflation, both historically and during the recent bout of inflation acceleration.
In particular, leading inflation indicators such as the PPI are highly correlated across the OECD countries.
A similar correlation is seen across the OECD countries for CPI as well.
As countries all have more or less independent fiscal and monetary policies to stimulate demand, a correlation of inflation factors suggests a supply-side phenomenon is also at issue.
di Giovanni builds on this work to decompose the relative influences of aggregate demand and supply shocks with regards to inflation within the US economy.
Arriving at a definitive understanding of the relative importance of demand and supply drivers of inflation is difficult without providing some formal structure that can be taken to the data. In the recent work referenced above, we take a step in this direction by building on the work of others to quantify the effects of the pandemic on inflation over the period spanning both the collapse and recovery phases of the economy. This framework not only allows us to examine the cumulative impact of the pandemic from 2019:Q4 to 2021:Q4, before the Russia-Ukraine war’s “energy/food shock” on inflation, but also to decompose the contribution of demand- and supply-side factors underlying the observed inflation.
Within this model, di Giovanni uses changes in the number of hours worked, coupled with changes to productivity, to establish how much of the current inflation is due to aggregate demand and how much is supply side related.
We calibrate a closed-economy version of the model to match the observed U.S. inflation over the 2019-21 period, along with doing a similar exercise for the euro area. The model implies that inflation is a function of aggregate demand shocks, changes in hours worked, and productivity by sector. The changes in hours worked capture both demand and supply shocks, while changes in productivity/technology are sectoral supply shocks.
We assume that sector-level technological changes were zero over the 2019-21 period and use the observed inflation rate along with sectoral hours worked to back out the implied aggregate demand shock. The computed aggregate demand shock captures several possible demand drivers, such as changes in households’ preferences for consumption in the present vs. future as well as expansionary effects of fiscal and/or monetary policy.
Di Giovanni then uses this model, plus relevant real world inputs, to compute a theoretical consumer price inflation rate covering the period 2019-2021, along with the decomposed drivers of that inflation.
What di Giovanni’s model shows is that aggregate demand constitutes roughly 60% of overall consumer inflation, and supply shocks the remaining 40%.
As di Giovanni only presents a summary of his model, I am unable to delve deeply into his analysis, but there are external metrics which tend to support his breakdown of inflation drivers. In particular, the Global Supply Chain Pressure Index, which amalgamates several supply chain indices such as the Baltic Dry Index for shipping rates, appears to track rather well with a 60% fraction of consumer price inflation during 2021.
This breakdown, however, leads to an interesting proposition: given that monetary policy works on the demand side of inflation, even if the Fed’s rate hikes were doing everything Jay Powell indicated they should do, they can only hope to curtail roughly 60% of inflation’s rise. The remaining 40% of inflation drivers are supply side elements that do not respond to changes in monetary policy such as interest rate hikes.
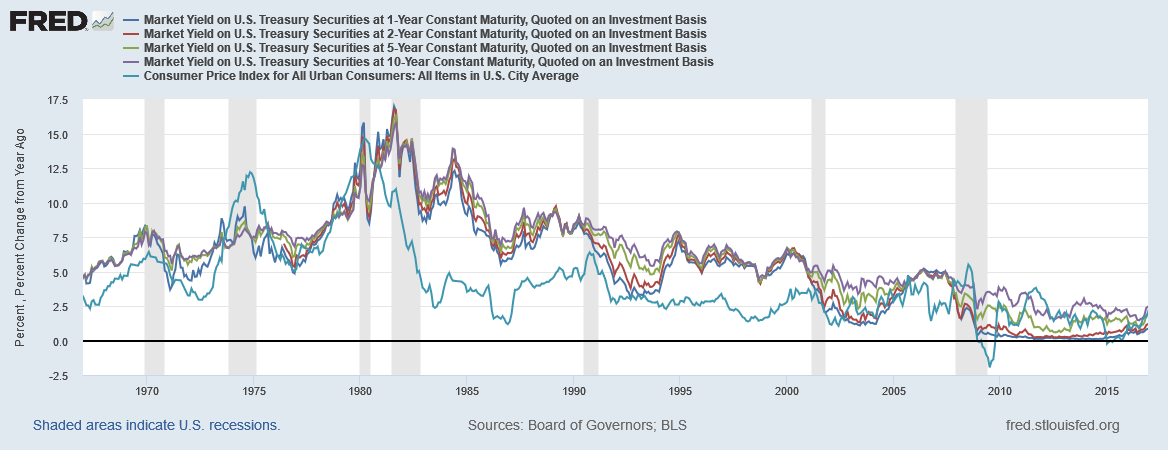
If we look at where market yields for various Treasury maturities are at currently, and compare them to the percentage rate equal to 60% of headline consumer price inflation, we see the lower-yield interest rates have already risen above where 60% consumer price inflation would be.
If we posit that inflation will continue to decline, than by the end of December, 60% of headline consumer price inflation will be lower than most if not all of the lower end of the yield curve.
This becomes significant when we remember that, after the Volcker rate hikes during the early 1980s, consumer price inflation fell below interest rates, and would remain there until the 2008 Great Financial Crisis, when interest rates and consumer price inflation became muddled.
The lower end of the yield curve is already greater than 60% of consumer price inflation as of November, which suggests that, in the best case scenario, the Fed has accomplished all it can regarding containing consumer price inflation, making further rate hikes increasingly suspect. If the Fed pushes rates higher, with inflation from aggregate demand already largely contained, it risks not merely a deeper recession, but a chaotic liquidity crisis within financial markets.
The run-up to the 2008 Great Financial Crisis gives us some precedent for this concern. Beginning in 2004, the Federal Reserve, first under Alan Greenspan and then Ben Bernanke, implemented a series of Federal Funds Rate hikes that extended up to June of 2006, carrying Treasury yields above headline consumer price inflation, and then held the Federal Funds rate at 5.25% even as inflation per CPI dropped to ~2-3%. The end result was the liquidity crisis within derivative markets now often referred to as the Great Financial Crisis (GFC), as collateralized debt obligations (CDOs) built upon shoddy mortgages became tainted with rising mortgage defaults, causing CDO valuations to collapse.
Even during the Volcker rate hikes, when Paul Volcker began implementing a second round of rate hikes within the Federal Funds Rate, he continued to raise interest rates even though inflation as reported by the CPI was declining, pushing the US into the deep 1981-1982 recession.
Continuing to push rate hikes even after consumer price inflation is on a downward trend carries an outsized risk of roiling financial markets and producing even more economic problems than “consumer price inflation”.
Has the Fed reached the limit of what it can hope to accomplish with interest rate hikes? Ultimately, we cannot yet say that for certain. We cannot even be certain the Federal Funds rate hikes will have the influence over interest rates Jay Powell and the Federal Reserve apparently believe they do.
What we can be certain is true is that the more the Fed raises rates without seriously scrutinizing economic data, the more likely it is something will break on Wall Street, precipitating a worse financial and economic crisis than the 2008 GFC.
Di Giovanni, J. How Much Did Supply Constraints Boost U.S. Inflation? . 24 Aug. 2022, https://libertystreeteconomics.newyorkfed.org/2022/08/how-much-did-supply-constraints-boost-u-s-inflation/
Di Giovanni, J., et al. Challenges for Monetary Policy in a Rapidly Changing World. 27 June 2022, https://www.ecb.europa.eu/pub/conferences/ecbforum/shared/pdf/2022/Kalemli-Oezcan_paper.pdf.
Akinci, O., et al. The Global Supply Side of Inflationary Pressures . 28 Jan. 2022, https://libertystreeteconomics.newyorkfed.org/2022/01/the-global-supply-side-of-inflationary-pressures/.


