Did The BLS Fudge Inflation Too Much? Or Not Enough?
Wall Street Tantrums When The CPI Printed Hotter Than Expected
What a difference a single night can make on Wall Street.
If one were to take the Bureau of Labor Statistics January Consumer Price Index Summary on its own merits, one might actually think that consumer price inflation was not all that bad, especially given the inflation numbers that have printed over the past several months.
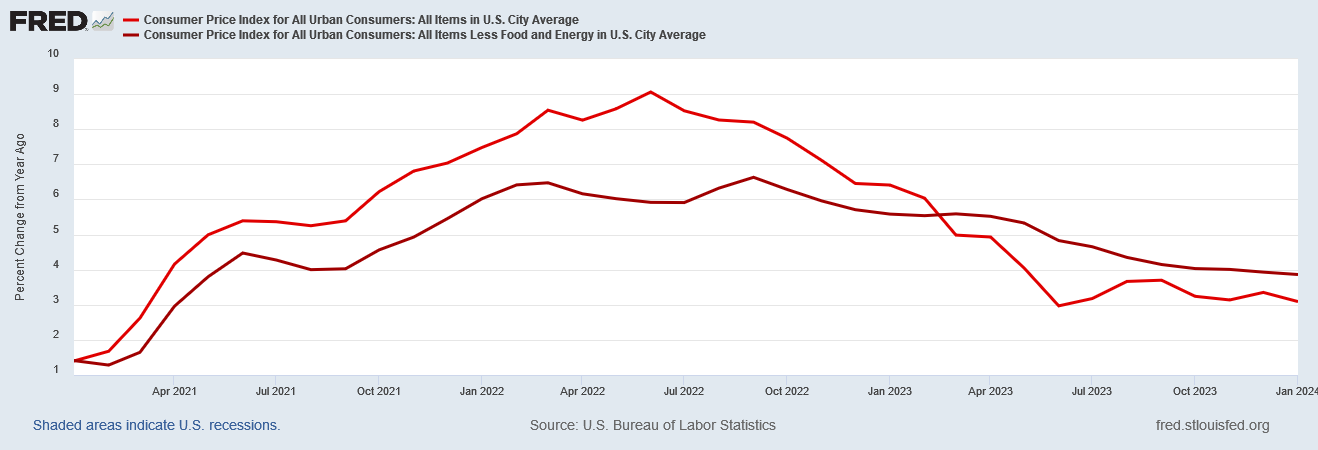
The all items index rose 3.1 percent for the 12 months ending January, a smaller increase than the 3.4-percent increase for the 12 months ending December. The all items less food and energy index rose 3.9 percent over the last 12 months, the same increase as for the 12 months ending December. The energy index decreased 4.6 percent for the 12 months ending January, while the food index increased 2.6 percent over the last year.
That’s moderately good news, isn’t it? Year on year inflation rose less in January than it did in December. Surely that counts as progress.
Wall Street did not see it that way.
As I noted Monday evening, Wall Street was expecting consumer price inflation to print at 2.9% year on year.
Monday evening, the expectation was not at all unreasonable, given what energy prices had done in recent months.
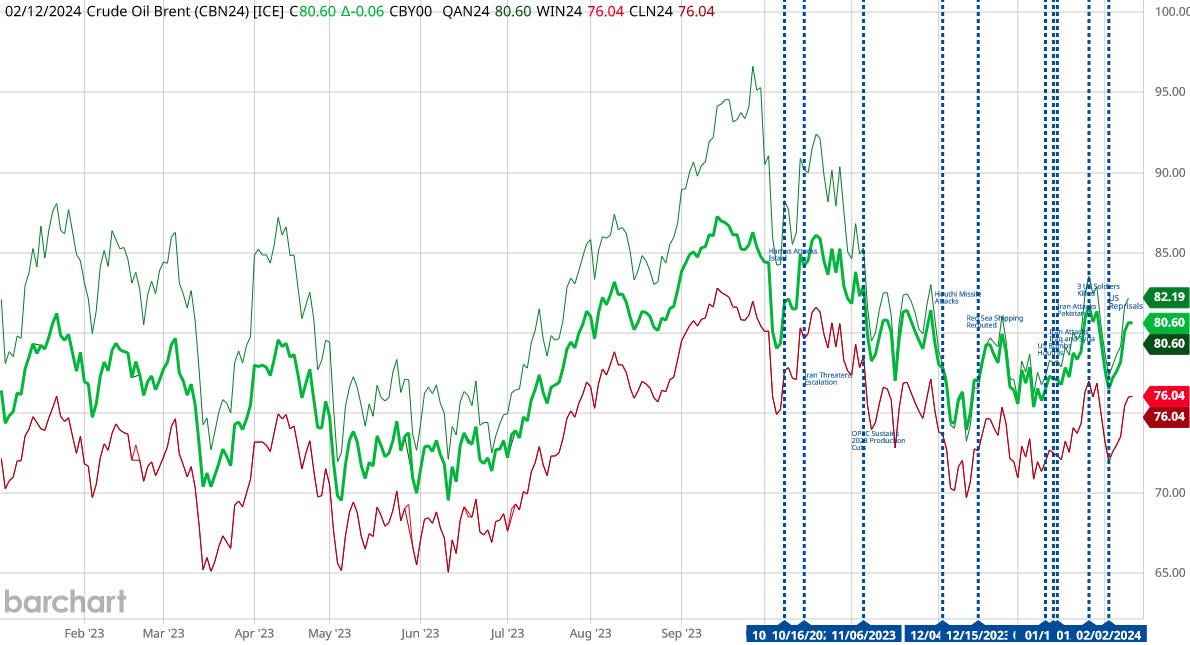
For all the volatility over the past twelve months, the spot price for Brent Crude had decline by approximately $4/bbl over those same twelve months. That alone was a significant deflationary (or disinflationary) signal. For that and other reasons, Wall Street was expecting the CPI report to print inflation at around 2.9% year on year, rather than the 3.1% that came in.
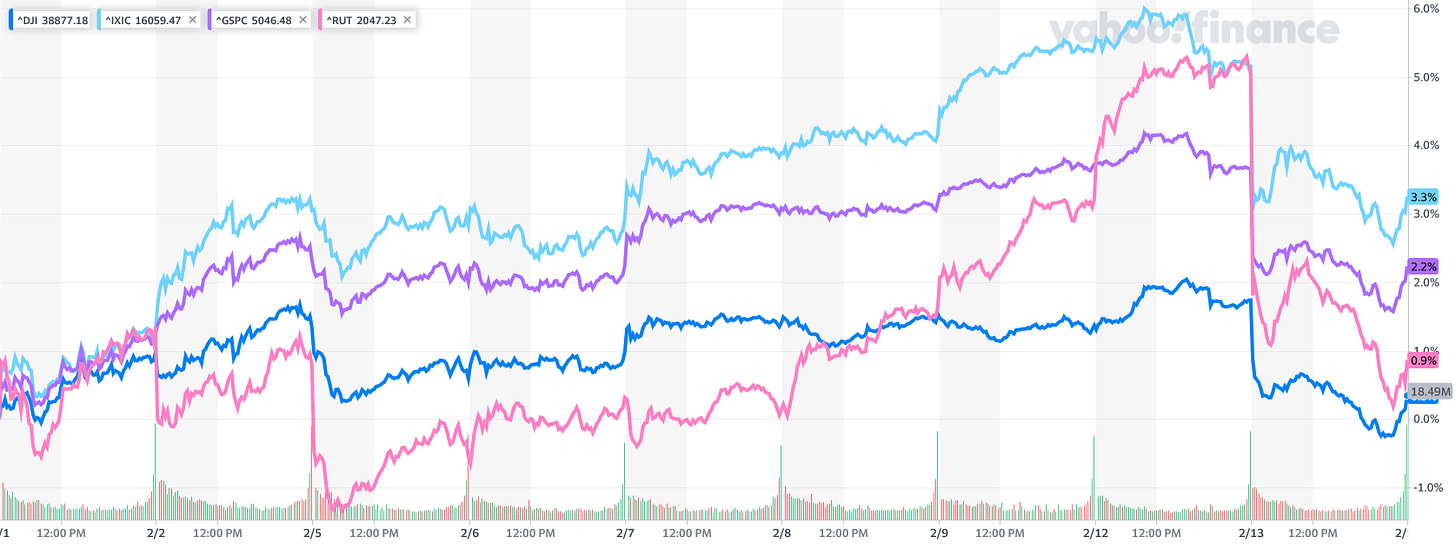
The financial market performances on the day told the tale of Wall Street’s response: tantruming.
Stocks took a dive Tuesday after a key inflation report revealed stubborn price increases, raising concerns on Wall Street that the Federal Reserve will keep rates higher for longer than anticipated.
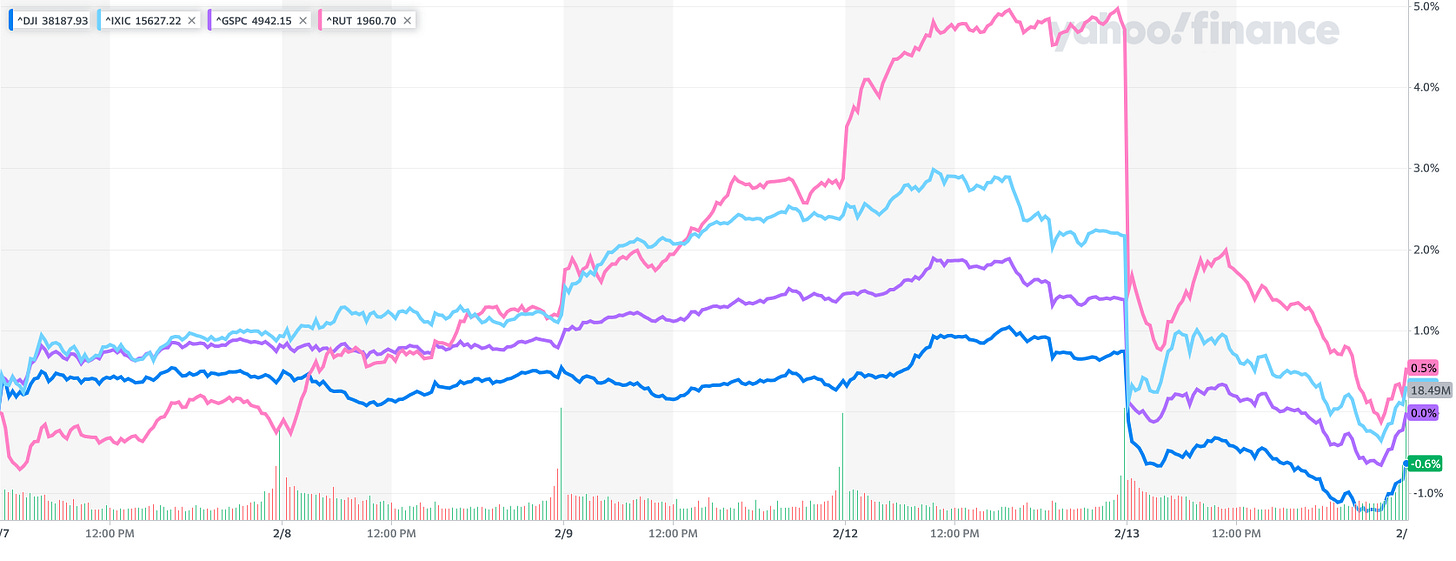
The Dow Jones Industrial Average slid 525 points, or 1.4%, on Tuesday, its largest single-day drop since March 2023. The blue-chip index nosedived more than 700 points at its session lows. The S&P 500 declined 1.4% and the Nasdaq Composite lost roughly 1.8%.
The latest Consumer Price Index revealed that prices rose by 3.1% for the 12 months ended in January, according to Bureau of Labor Statistics data released Tuesday. On a monthly basis, CPI rose by 0.3% last month.
Both measures came in hotter than expected: Economists expected inflation to ease to 0.2% from December and slow to 2.9% annually, according to FactSet.
Ironically, Wall Street might have been somewhat misled by the BLS’ annual CPI “corrections” last week, updates across the previous year that potentially magnified inflation in January. In further proof of Wall Street not really looking at any of the financial data and pondering its significance, brokers and hedge funds managed to overlook nearly a full tenth of a percentage point of downward revision to prior month’s data, which might have contributed to January’s larger than expected inflation print.
In other words, did the BLS fudge the inflation numbers too much, or not enough?
To properly deconstruct the CPI data, we first have to explore what the BLS did last week to “correct” the data.
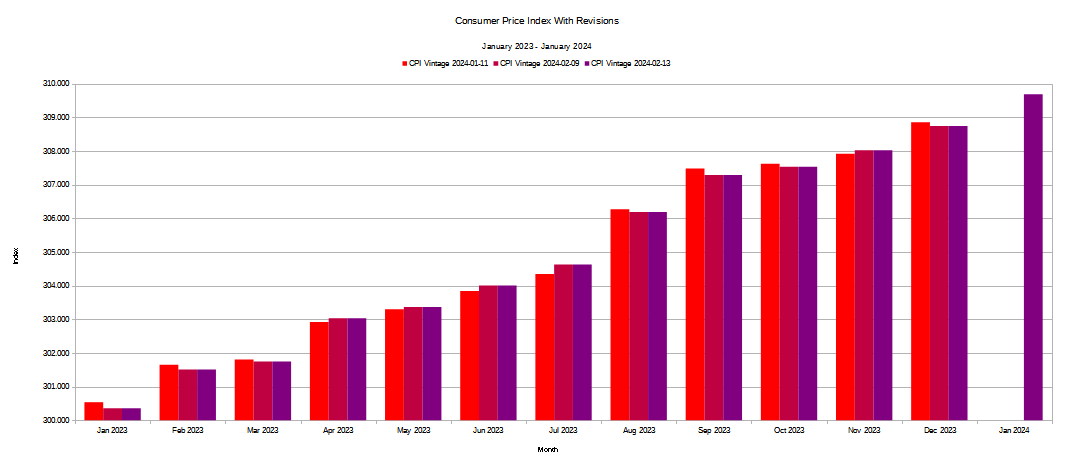
As of February 9, the BLS went through the entire 2023 data set and revised several of the numbers either up or down—with the aggregate Consumer Price Index being revised down in most months.
While this adjustment to the historical data set may have been grounded in greater data accuracy, one consequence of the revisions is that the year on year and month on month changes for January, 2024, both start with a lower initial value than they would have otherwise. As it turns out, the impact of that lower initial value is arguably not insubstantial.
The change added 0.04 percentage points to the month on month inflation rate.
That change added 0.06 percentage points to the year on year inflation rate.
Is that 0.06% the source of Wall Street’s anger and angst? It might not be the only source but it surely is a contributing factor. Had consumer price inflation printed at 3.04% year on year, it would have just barely missed coming in below 3.0%. Instead, consumer price inflation printed at 3.1%, a solid miss.
The possibility of the BLS committing an “own goal” on the inflation numbers is a tempting supposition to make—even as we are forced to admit that, at most, it is an highly speculative one with not a lot of evidentiary support to back it up.
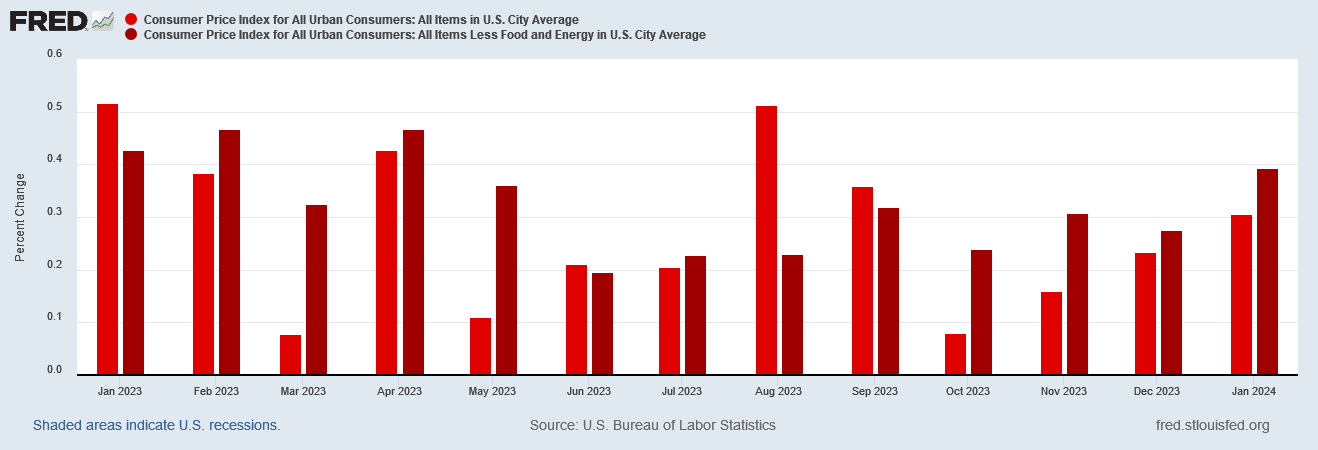
While the BLS very likely did not help itself any with the annual revisions, we must also acknowledge that the month on month inflation trend has been upward the past few months.
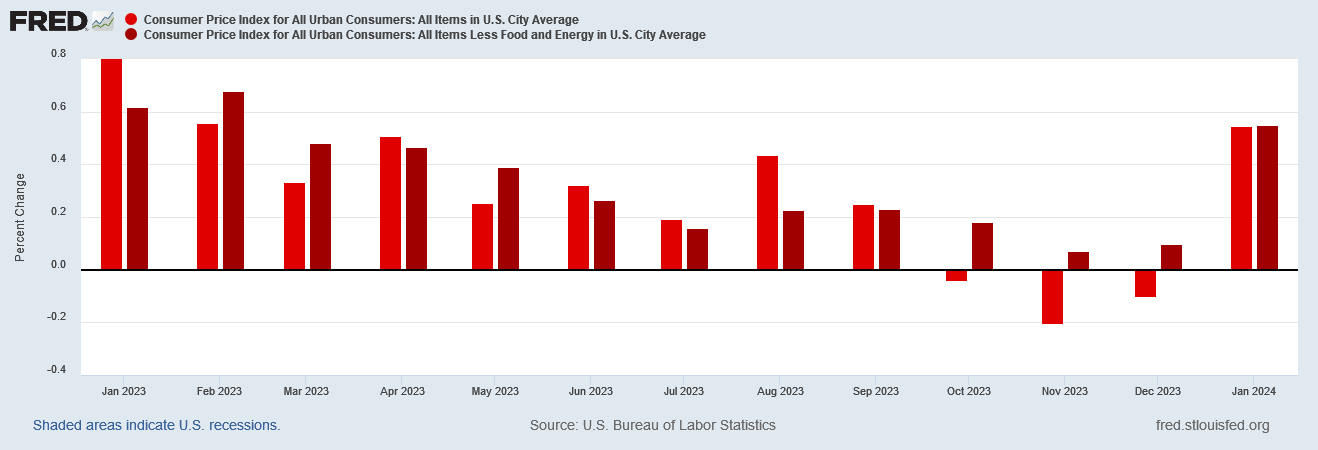
After printing a relatively good month in October of 2023, the month on month inflation rate has risen steadily.
Even the month on month inflation trend within the unadjusted data shows January posting a dramatic reversal from the previous months price declines at the headline level.
With or without the CPI “corrections” to the historical data set, we have clear indication that consumer price inflation is heating up, and that it has been for the past few months.
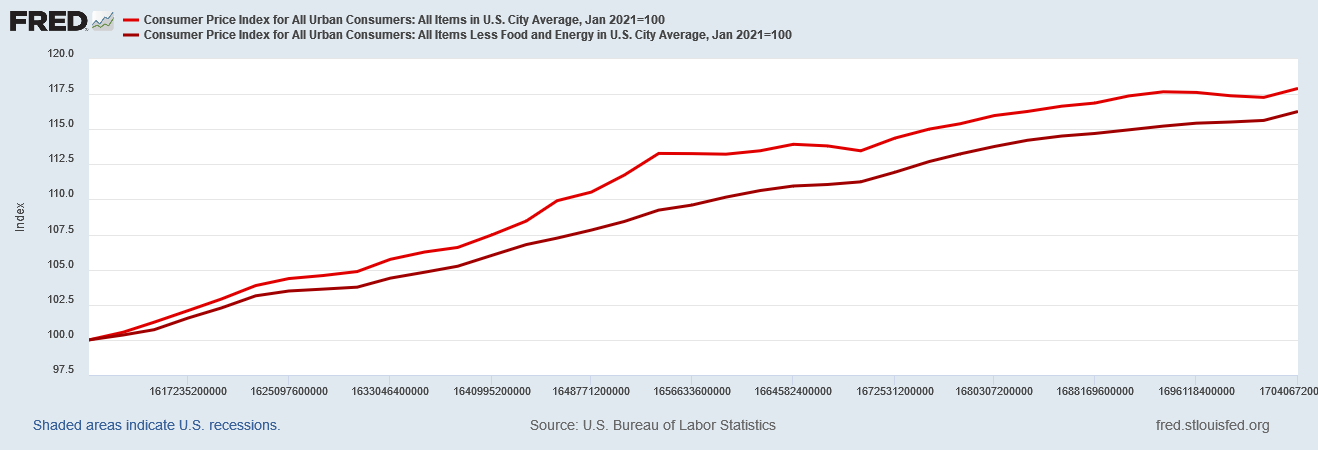
The likely trend for inflation has been the exact opposite of what Wall Street wants to believe is the trend, and they have lulled themselves into believing in the wrong trend because they simply have not looked closely at the details of the CPI report. Even if we just index the headline index as well as the “core” index (headline less food and energy) to January of 2021, both metrics show the pace of inflation picking up in January of 2024..
That uptick in the headline and core indices serves to emphasize why it is important to scrutinize both the year on year inflation change and the month on month inflation change. If we were to confine our assessment to just the year on year figure, we would miss the signs of inflation heating up in recent months.
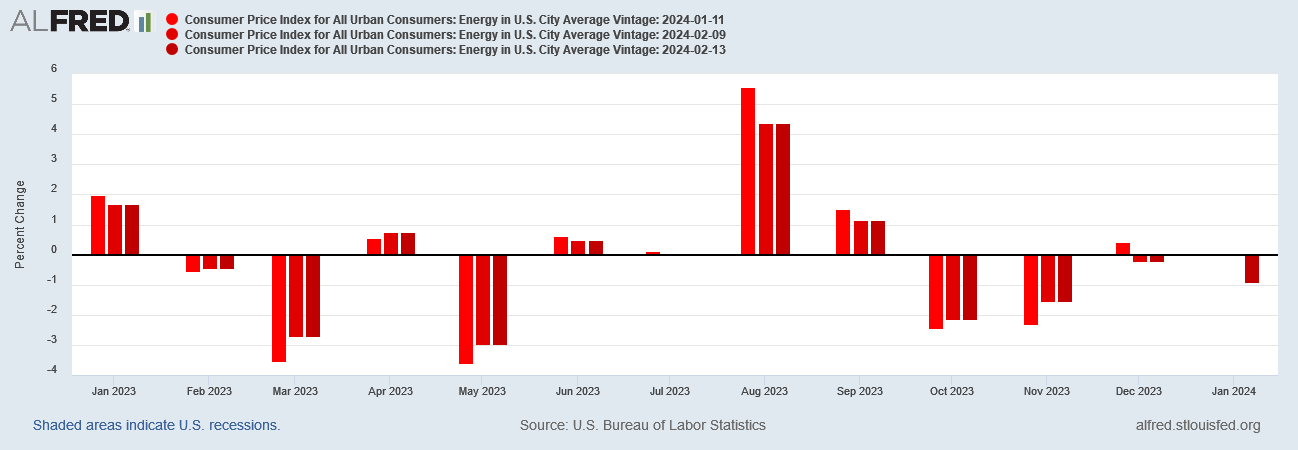
By the same token, if we fail to scrutinize the changes in various subindices—especially the highly influential energy subindex—we would miss the impact of the BLS revisions turning December’s interval of energy price inflation into energy price deflation.
Arguably, the BLS either deliberately or accidentally forward-shifted a portion of the energy price deflation that might otherwise have been recorded in January, which again leads us back to the question of the BLS either fudging the inflation data too much or not enough.
Even without scrutinizing the historical data, however, we have ample information within the CPI report that undercuts both the “declining inflation” narrative and the expectation of Wall Street that inflation would comply with investors’ wishes and print below 3% year on year.
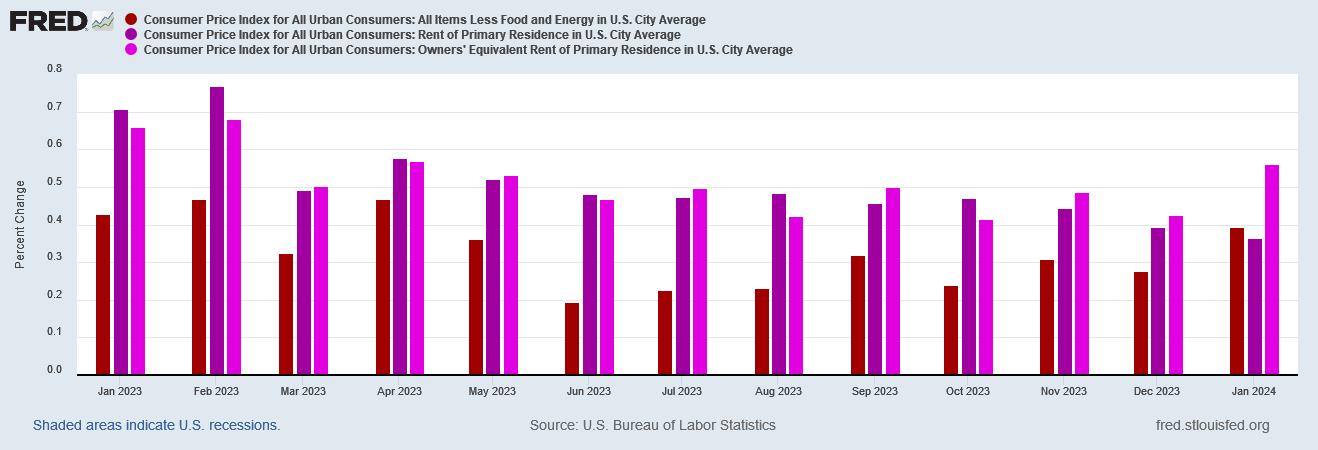
Most notably, January saw a spike in Owners’ Equivalent Rent of Primary Residence—one of the synthetic metrics the BLS uses to gauge the monthly “cost” of housing.
While the way in which the OER is calculated makes the metric a perenially trailing indicator on what is actually happening with inflation for housing prices, the fact that it could surge in that fashion is testament to the reality that, contrary to the Wall Street narrative, the Fed’s rate hike strategy really has not corralled consumer price inflation at all.
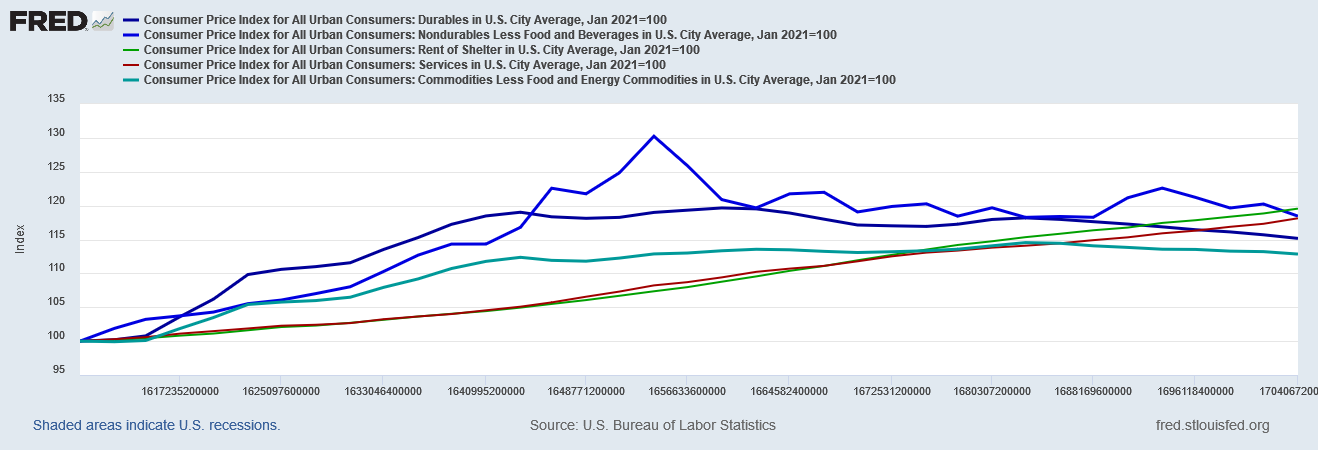
Nor is OER the only metric that bucks the Wall Street narrative. If we index Durable and Non-Durable goods, as well as Rent of Shelter, Services, and Commodities, we see that, even though prices have trended down for the Durable and Non-Durable goods subindices, they have steadily risen for Services and Rent of Shelter.
The major point to note here is that inflation for services and shelter costs has, according to the BLS data, been largely unaffected by anything that the Federal Reserve has done on interest rates. With or without rate hikes, with or without yield declines, service price inflation and shelter price inflation have proceeded almost at a constant pace since 2021.
These are the little nuggets of information that get buried in the BLS reporting and completely ignored by Wall Street and the corporate media.
Putting the matter bluntly, what the data shows is Wall Street getting gob-smacked by reality. Inflation is not really coming down in any reliable sense, and is even showing signs of increasing in multiple subindices as well as the headline numbers.
Unsurprisingly, Wall Street freaked out when reality set in this morning—and as Wall Street does when they get a reality check on anything, they start selling. Today was no exception, with the Dow Jones and other stock indices posting record or near record declines on the day.
At the end of the day’s trading yesterday, the Dow Jones had succeeded in erasing all of the gains built up over the past week.
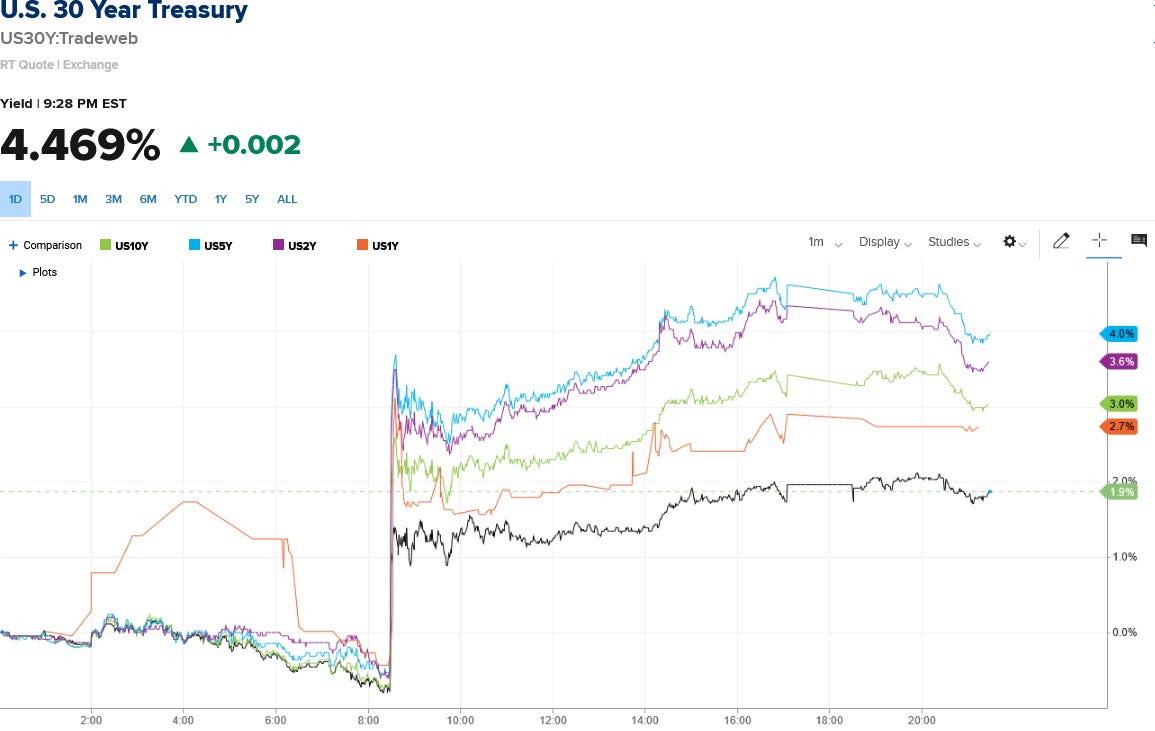
Bond yields rose as precipitously as stock prices fell.
Yes, Wall Street had a genuine tantrum over inflation. Irony abounds.
What the January inflation numbers told Wall Street was that, once again, they had been deluding themselves with the comforting but fundamentally false belief that the Federal Reserve was on the verge of reducing the federal funds rate. The January inflation numbers denied Wall Street the capacity to continue to ignore the data and the trends within that data, as it has been doing for quite a few months now.
With the Federal Reserve demonstrably clueless on how to read economic data or how to apply that data to monetary policy, the January inflation report was a blunt rejection of Wall Street hopes that the Federal Reserve could be soon persuaded to bring back free money and cheap money.
What is arguably worse for both Wall Street and Main Street is that the January inflation report is a confirmation of what I assessed from the December inflation report last month: inflation is “back” in the US economy.
Ultimately, the BLS data shows not only that inflation is “back”, but that in several substantive ways it never really left. The BLS data also shows we’re likely to be stuck with elevated inflation for some time come, as higher inflation rates are becoming embedded in the US economy, even as the economy declines.
That conclusion is reiterated this month as well.
The Federal Reserve is not “winning” its fight with consumer price inflation. “Bidenomics” is not making the US economy stronger. The US economy itself is not doing at all well.
All of which runs counter to the “official” narratives from both Wall Street and Washington—and yet which the sudden realization of which explains the dramatic one day drop in equity indices and the one day surge in Treasury yields.
Did the Bureau of Labor Statistics try to paper over the danger signals present in the data with last week’s revisions? Ultimately, that is just a speculation. There is little evidence to affirmatively support the notion of that level of chicanery within the BLS.
At the same time, there is no reason to conclusively reject that speculation as idle “conspiracy theory”. While it is generally a prudent and parsimonious position to refrain from assuming malice when stupidity will suffice to explain a particular data set, prudence and parsimony also compel us to acknowledge that malice and stupidity are never mutually exclusive. It is quite conceivable the BLS has been both malicious and stupid with its adjustments to the historical data.
Wall Street was expecting a considerably different inflation report, and the BLS demonstrably failed to deliver that report. Whether that was by accident or by design is a conclusion I leave each reader to reach on his or her own.






"It is quite conceivable the BLS has been both malicious and stupid with its adjustments to the historical data."
Or, stupid and malicious, a trait with this administration. Malicious is the intent, and stupidity intervenes.
Mr. Kust, well done!
If i am not mistaken, BLS obtains OER by asking homeowners what they think they could get for rent. This is compared to case-shiller which uses actual prices. And back on November Goldman wrote how the response rate to these surveys is plummeting, which begs the question of why they should be trusted.