Factory Gate Inflation Charts Rising Energy Prices
PPI Trends Are Energy Price Trends And Vice Versa
Inflation is heating up again, regardless of what the Fed says or even believes.
While we can debate the precision of the Bureau of Labor Statistics inflation reports, particularly with respect to the magnitude of the trends up and down, the totality of the data leaves little room to doubt but that inflation is currently trending up once more. The most recent data point to show this is the February Producer Price Index Summary, which shows factory gate inflation moving up for the second month in a row.
The Producer Price Index for final demand rose 0.6 percent in February, seasonally adjusted, the U.S. Bureau of Labor Statistics reported today. Final demand prices increased 0.3 percent in January and edged down 0.1 percent in December 2023. (See table A.) On an unadjusted basis, the final demand index advanced 1.6 percent for the 12 months ended in February, the largest rise since moving up 1.8 percent for the 12 months ended September 2023.
In February, nearly two-thirds of the rise in final demand prices can be traced to the index for final demand goods, which advanced 1.2 percent. Prices for final demand services moved up 0.3 percent.
Readers of this Substack will note that I have been commenting on inflation’s unwelcome return for some time now.
Inflation is rising in this country, once again taking bigger bites out of worker paychecks. Inflation is rising, and the PPI data suggests it will continue to rise for the next few months at least.
Welcome to 2024
Perhaps it should be no surprise, however, that Wall Street “experts” did not expect the Producer Price Index to print as hot as it did for February—once again they were caught unawares of the reality of inflation.
The producer price index, which measures pipeline costs for raw, intermediate and finished goods, jumped 0.6% on the month, the Labor Department’s Bureau of Labor Statistics reported Thursday. That was higher than the 0.3% forecast from Dow Jones and comes after a 0.3% increase in January.
Excluding food and energy, core PPI accelerated by 0.3%, compared to the estimate for a 0.2% increase. Another measure that also excludes trade services increased 0.4%, compared to the 0.6% gain in January.
Yet this really should not be a surprise. The data has been signalling resurgent inflation at both the consumer price level and the producer price (factory gate) level. How the “experts” expected producer price inflation to remain constant from January is a mystery.
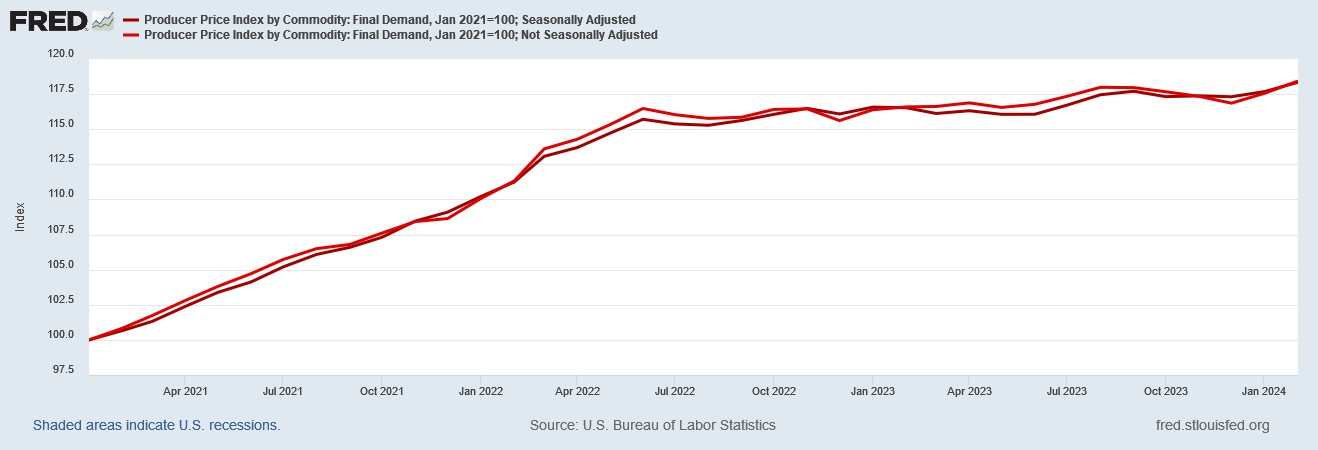
When we look at the Producer Price Index itself (indexing it to January 2021), there is clear indication that inflation has begun to heat up once more, with a definite inflection point coming in December of last year.
For both the seasonally adjusted data and the raw unadjusted data, the curve turns up in December, as becomes clear if we focus on 2023 and beyond.
The factory gate deflation of last fall has at least for now turned into factory gate inflation. Even more worrisome is the reality that the February uptick was larger than the January uptick, which was also the shift from factory date deflation to factory gate inflation.
Factory gate inflation is not merely rising, it is showing signs of rising at an increasing rate—a trend which suggests inflation could have some room to rise before a new peak rate is reached.
As producer prices are the precursor of consumer prices, we can expect this most recent inflationary impulse to be transmitted through to the Consumer Price Index over the coming months, which means we are looking at a few months at least where consumer price inflation is also likely to rise once more.
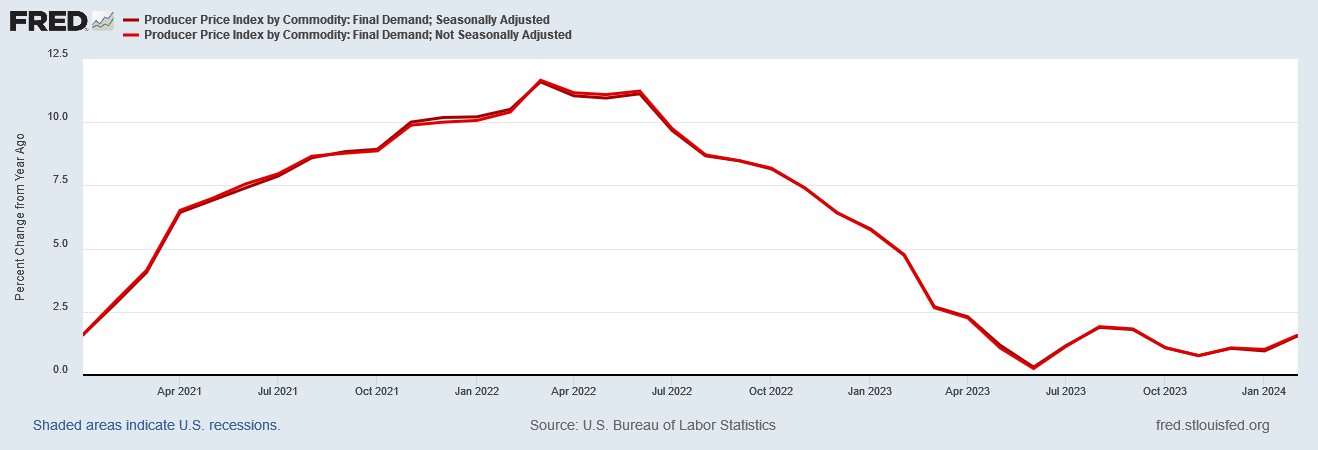
Perhaps even more damning to the “experts” caught off guard by the “hotter than expected” PPI print is the reality that, viewed year on year, factory gate inflation has been moving up since last summer.
When we look at the vagaries of the year on year chart, it is easy to see how month on month factory gate deflation can occur even when year on year we are seeing factory gate inflation. The differential in the basis for comparison makes such phenomena not only rational but even predictable.
Factory gate inflation hit a year on year minimum in June of last year, and the year on year trend has been up ever since. Beginning in November of last year, the inflections in the year on year chart have all been upward—which means factory gate inflation has been getting steadily hotter over time.
Nor is there any great mystery as to why factory gate inflation is moving up: Energy prices are moving up, and especially moving up since the start of 2024.
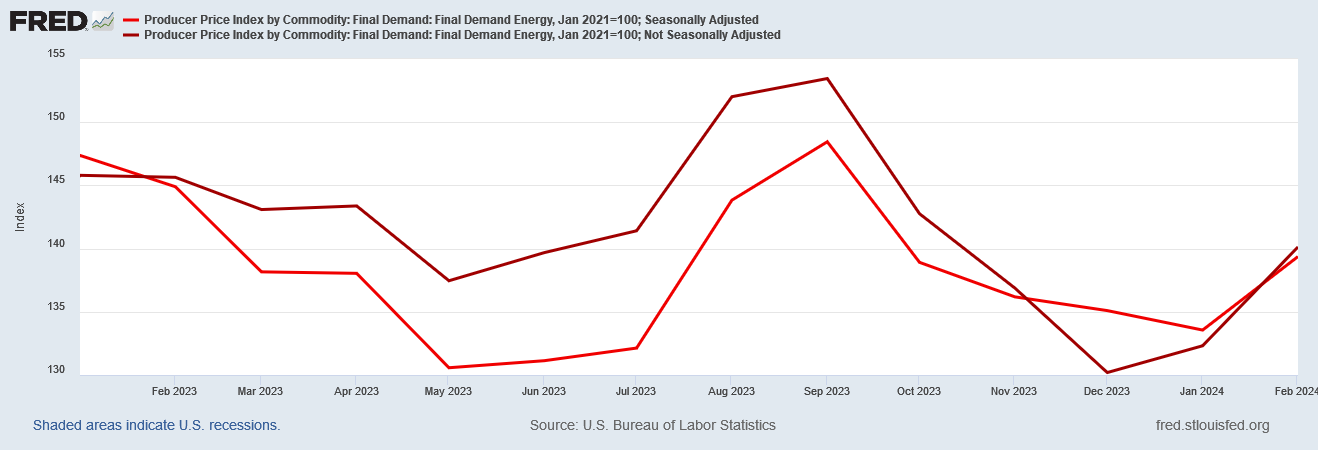
When we look at the Producer Price Index for Final Demand Energy (indexed to January 2021), we see the chart begins bending back up (rising inflation) beginning last summer, with that trend increasing beginning this year.
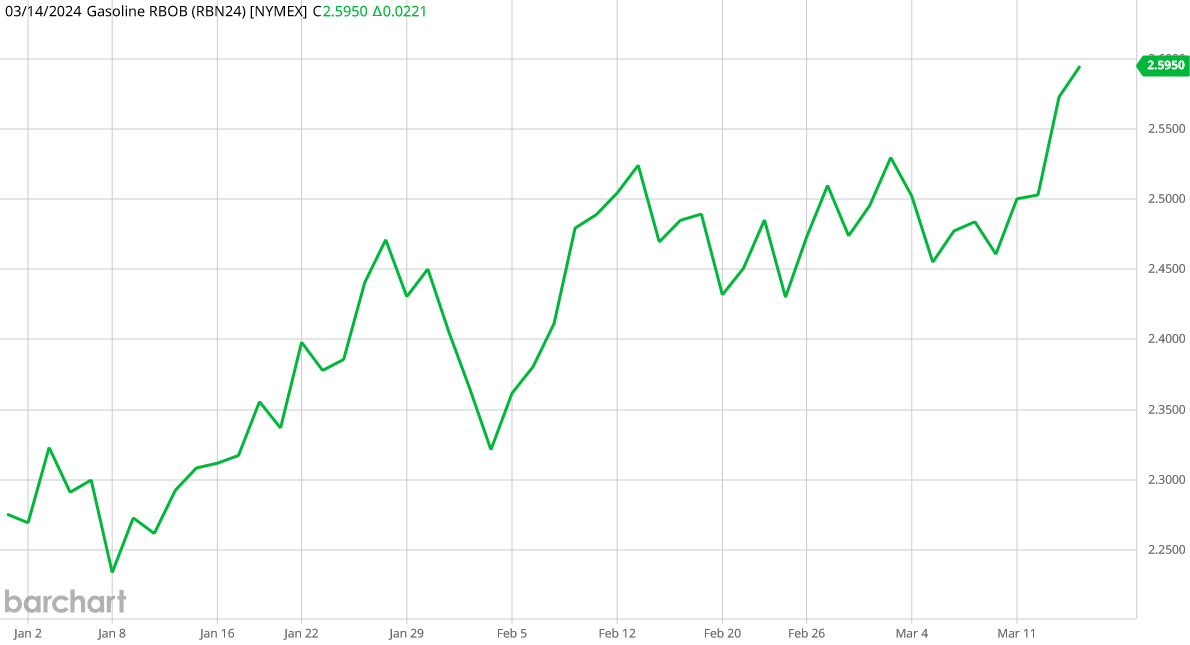
Unsurprisingly, when we look at market pricing for energy commodities such as gasoline, we are seeing rising prices for 2024.
We see the same trend in crude oil prices as well.
When we look back at crude oil prices to the beginning of 2023, we see prices start to trend up in…wait for it…June.
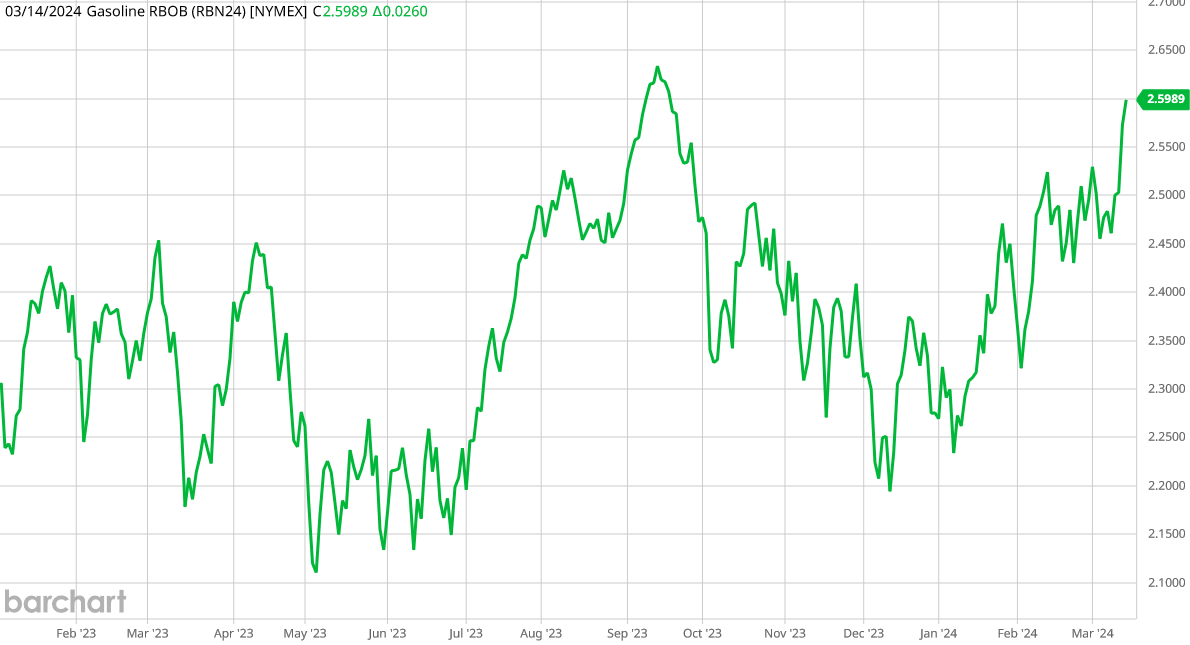
Even with gasoline futures we see the same inflection and the same timing—while there was an extended period of falling prices last fall (which is reflected in the PPI for Final Demand Energy), the larger macro trend has been upward since last June.
When we compare the market charts for energy commodities to the PPI for Final Demand Energy chart, we see the same broad trends up and down in both since the start of 2023.
The month on month aggregate PPI for Final Demand chart shows the same up and down trends in the same timeline.
Even the year on year PPI for Final Demand chart shows broadly similar trends up and down on this same timeline.
The upward inflection in energy prices has been the upward inflection in the PPI, and will be the upward inflection in consumer price inflation in due time.
These up-and-down trends for factory gate inflation and energy prices are nothing new. Last fall, when the immediate trend in the PPI was disinflation or outright deflation, energy prices were the driving factor.
While the longer term trends have been up for both factory gate inflation and energy prices, last fall global events repeatedly presented energy price deflation within that larger curve.
Even events in the Middle East and the conflicts between Hamas and Israel, as well as the Iranian backed missile mischief of the Houthi militias in Yemen, have only had incremental upward influence on oil prices.
On the one hand energy prices are trending up since last June, yet at the same time energy prices are trending down since last September, a curious and counterintuitive scenario for global energy prices.
Since the start of 2024, the prevailing trend in energy prices has been energy price inflation, and that is transmitting through to the PPI as overall factory gate inflation. We should not be surprised to see that trend transmitted through to consumer price inflation over the next several months as well.
We have not yet seen a breakout of energy prices towards the psychological important $100/bbl price threshold. For most of the time since Hamas’ October 7th attacks on Israel, the capacity of even the Houthis holding the Red Sea shipping lanes hostage has only succeeded in incremental price gains for energy commodities.
Yet the potential for such a breakout remains, and in the meantime the incremental gains are accumulating, pushing prices incrementally ever higher. Should events fail to continue to push energy prices upward, should energy price deflation return, then the Producer Price Index will likewise trend downward once again. At present, energy prices are moving up and taking the PPI along for the ride.
Last fall the PPI was charting near term deflation. Since the start of 2024 the PPI is charting inflation at least for the near term.
Last fall energy prices were charting down. Since the start of 2024 energy prices are charting up.
What will happen next in factory gate and then consumer price inflation? Whichever the trend is, it will almost certainly be seen in market energy prices first.










Well, more bad news for my wallet, sigh. Good thing I drive a subcompact car.
The fun thing will be watching the Biden administration and media cronies try to hide this, spin this, and blame this on Trump. What new manipulations can they devise? They’re going to have to really twist themselves into pretzels on this data!