As early as yesterday, it was quite apparent that the June CPI Report from the Bureau of Labor Statistics was going to be beyond ugly. When the White House began launching preemptive spin in advance of the report’s release, that the report was going to be a disaster was a foregone conclusion.
The report did not disappoint—the CPI data is indeed ugly.
The Consumer Price Index for All Urban Consumers (CPI-U) increased 1.3 percent in June on a seasonally adjusted basis after rising 1.0 percent in May, the U.S. Bureau of Labor Statistics reported today. Over the last 12 months, the all items index increased 9.1 percent before seasonal adjustment.
In May official consumer price inflation was running at 8.6%. In June it topped 9.1%. Not only did inflation not “cool down” in June, it got even hotter than before.
Government efforts to rein in inflation, such as they have been, have so far been a complete and utter failure. There is simply no other way to look at the data.
The “Experts” Were Wrong….Again
One month ago to the day I commented that finance pundit and prognosticator Mohammed El-Erian’s prediction that inflation could go as high as 9% was wildly optimistic.
It took the space of one month and a single CPI report to prove me right. I said then that we could see 9% inflation as early as June, and here we are at 9.1%.
Nor was it just El-Erian who undershot on inflation. As I noted the other day, Edward Yardeni predicted headline inflation would come in at 1.1% for the month, and financial web site Trading Economics forecast 8.8% year-on-year. Both estimates were fall short of what actually printed today.
Yet the importance of my observations back then is not just about bragging points. It underscores the reality that the “experts” truly have no good understanding what is happening in the global economy. They do not understand why inflation is happening now, why it continues to get worse each month, and thus have no good idea of what will eventually cool inflation down.
With that reality in mind, let us consider some of the spin-doctoring that emerged starting yesterday as regards the June CPI report.
Is The Price Of Gas Going Down Or Not?
The most notable bit of spin came yesterday, when National Economic Council Director Brian Deese stated that today’s inflation numbers would not include recent shifts in the price of gasoline (energy is typically a major factor in inflation shifts).
One day before the release of the consumer price index for June, President Joe Biden’s top economic advisers issued a memo designed to temper the likely public reaction to a new round of recorded price spikes.
The CPI data coming Wednesday “will largely not reflect the substantial declines in gas prices we’ve seen since the middle of June,” wrote National Economic Council Director Brian Deese and Cecilia Rouse, chair of Biden’s Council of Economic Advisers, in a five-page memo designed to provide “context” for the upcoming report.
According to June CPI data, 12-month gas price inflation is at 59.9%, with month-on-month gas price inflation registering at 9.9% unadjusted, and 11.2% on a seasonally adjusted basis. Brian Deese went on record saying that figure did not factor in recent price declines in gasoline.
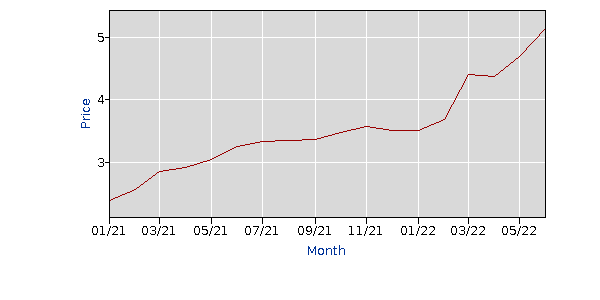
The average price data for gasoline within the CPI data sets shows the average price of gas in the US during the month of June was $5.149/gallon.
According to the American Automobile Association, as of June 30, the average price for gas in the US was approximately $4.85/gallon.
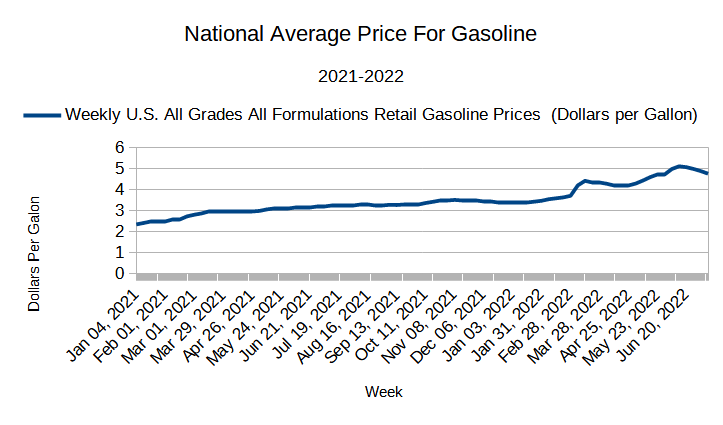
According to the US Energy Information Association, during the week of June 27th, the average price of gasoline in the US was $4.979/gallon, and peaked at $5.107/gallon during the week of June 13. The average price of gas, per the EIA data, during June was $5.032/gallon.
The EIA data shows the price of gas during the week of May 30th to be $4.727/gallon, and the average of the weekly gas prices during May was $4.545, which would make the June average price based on the EIA data 10.7% higher than the May average.
While the CPI price metric for gasoline in June is clearly higher than the average reported price for gasoline as of June 30th, it still captures most of the rise in average reported prices.
In other words, Brian Deese is flat out wrong. The CPI report does reflect broad price increases for gasoline during June.
But…Core Inflation Is What Matters, Right?
Brian Deese also claimed that “core inflation” (inflation less food and energy) was down for the quarter.
So-called core inflation, which strips out the volatile food and energy prices, has already shown signs of easing, they said, and is now running at an annualized rate of 4.2 percent this quarter, down from 4.5 percent in the first quarter of this year and 6 percent in the final quarter of 2021.
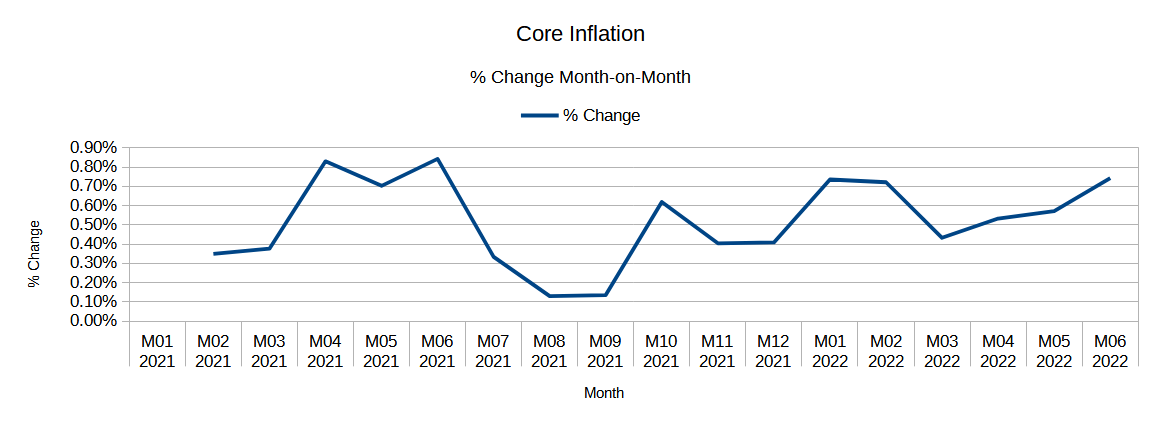
When we interrogate the CPI data sets, however, we find that the unadjusted CPI for all items less food and energy for June is 294.680, and for May was 292.506. In June of 2021, the CPI for all items less food and energy was 278.218. On a percentage basis, that works out to a monthly increase of 0.74%, and a 12-month increase of 5.92%. The 12-month increase for June is lower than the 12-month increase for May of 6.02%.
While it is technically true that, if you strip out food and energy prices, inflation is down year-on-year, on an unadjusted basis core inflation still rose from May to June.
Brian Deese apparently used a touch of Lou Costello Math to get to his core inflation numbers.
Of course, since most consumers are mightily concerned about putting food on the table and gas in the tank, the extent to which the “core inflation” argument is even relevant is itself more than a little problematic. While as a matter of pure economic analysis, how individual consumer price categories are shifting is a relevant question deserving of some scrutiny, attempting to shift the debate to “core inflation” numbers when the headline number shows food and energy prices getting worse is guaranteed to engender a reaction similar to Judge Judy Sheindlin’s memorable line “Don't pee on my leg and tell me it's raining.”
The reality: inflation—food price inflation, energy price inflation, core inflation, inflation inflation—is getting worse right now, not better.
Not A Surprise Based On The Data
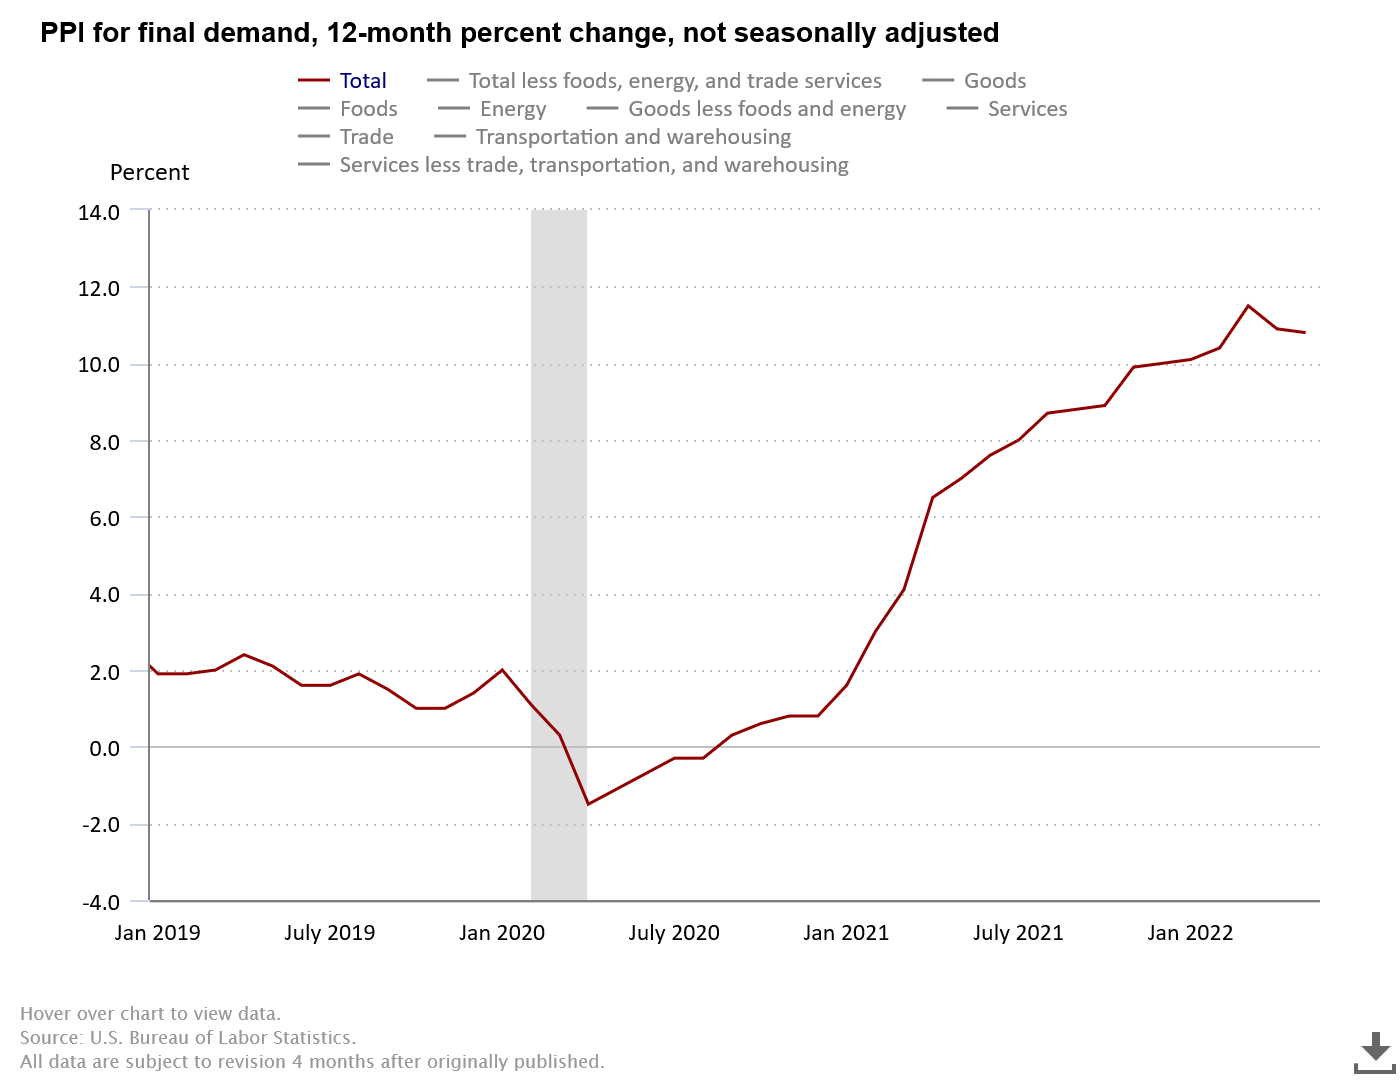
As I pointed out last month, the current rise in consumer price inflation was in broad strokes almost inevitable based on trends in the Producer Price Index, which is a general leading indicator for movements in the CPI.
Because of where the PPI measures prices for goods and services, it generally acts as a leading indicator for the CPI—an upward trend in the PPI is generally followed by a similar trend in the CPI within a reporting period or two. Looking at the PPI and CPI for the United States since 2017, we can see that this is indeed the case.
While May’s producer price inflation clocked in at 10.8% year-on-year, down from the March peak of 11.5%, is was and still is well above consumer price inflation.
Thus, even though there has been a decline in producer price inflation since March, the size of the margin of producer price inflation above consumer price inflation meant that there were still inflationary forces as yet unresolved. Should the downward trend in the PPI continue, that will indicate that we are indeed at or near peak inflation for the CPI, but the inflation recorded by the Producer Price Index still has to percolate through to the Consumer Price Index before the CPI can join in the downward trend.
With the PPI data due to be released tomorrow morning, we shall soon have an idea of what the future holds for inflation in this country.
The Stagflation Scenario Still Holds
One thing the CPI report confirms is that a deepening stagflation is not merely the ‘worst case” scenario, but is increasingly the likely scenario—also very much in line with my earlier prognostications on the topic.
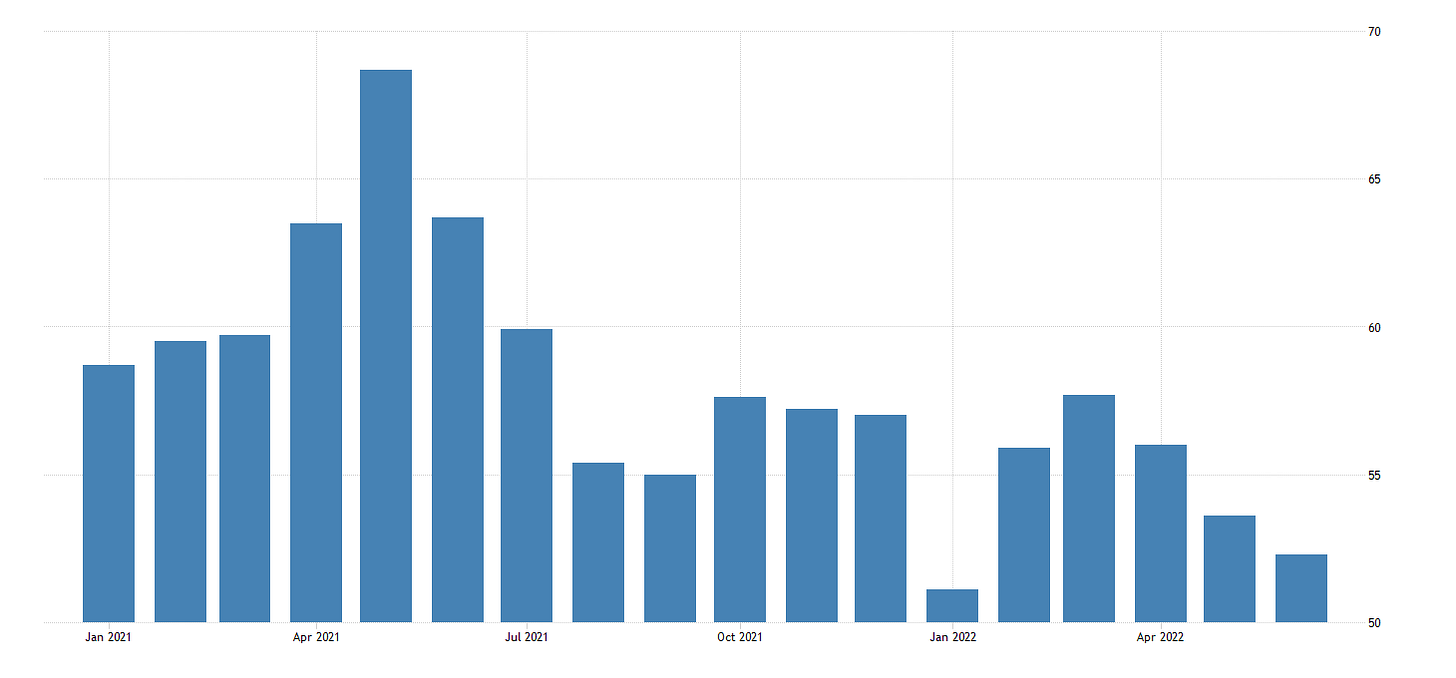
Although the US Purchasing Managers’ Index numbers have been revised upward for June from their initial release, there is still a significant deterioration from May.
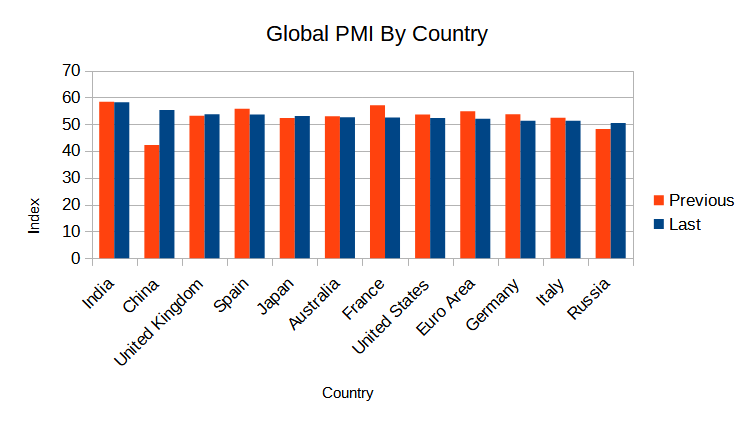
This is a trend that is seen globally; only China shows a greatly improved PMI for June over May, and that is largely the result of stimulus measures specifically intended to goose the economy. Across much of Europe, PMI numbers are still showing economic deterioration and recession.
Consumer price inflation plus PMI deflation still equals stagflation.
While much will be said in the media about how the markets reacted to today’s inflation numbers, and what the Fed is now likely to do next, the reality is that today’s CPI report merely confirms what most consumers already know: rising prices mean Americans are paying more and buying less. That makes recession not just an hypothetical possibility but an actual reality. It’s here, it’s now, and it’s hitting everyone squarely in the wallet.
The government is losing its battle with inflation. Americans are losing their shirts.


I'd be careful believing any data the EIA is pushing out now, since they changed their "methodology" for gas and diesel price collection in June. I'll save you the rest of my government data rant, which can pretty much be summed up as "Old Man Yells at Sky".
Superb job.
This 'core inflation' spin can't ignore the reality of food and transportation costs going up effects everything!